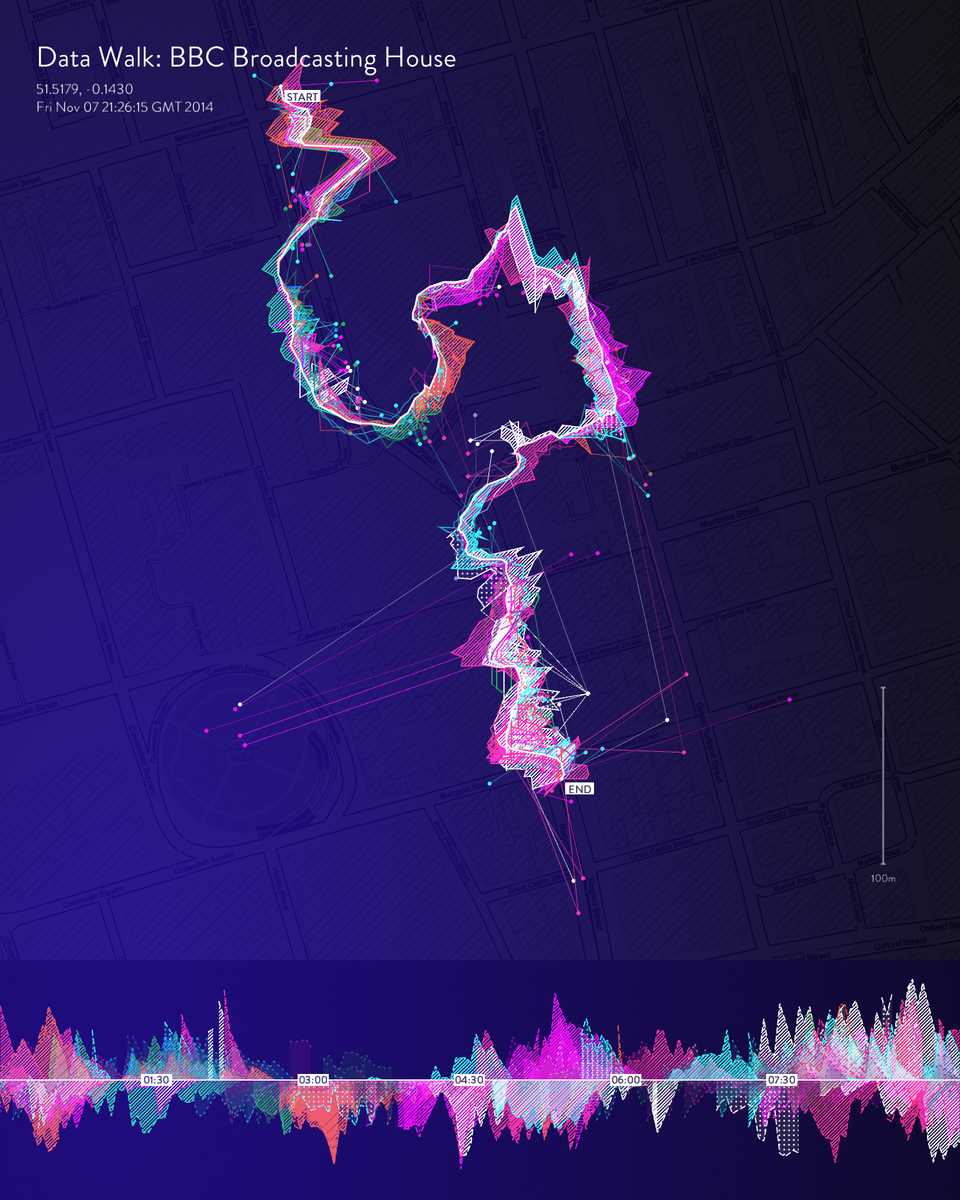
Phantom Terrain
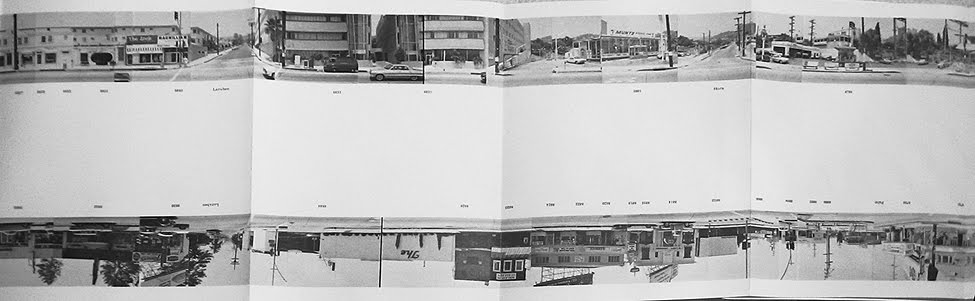
Every Building on the Sunset Strip
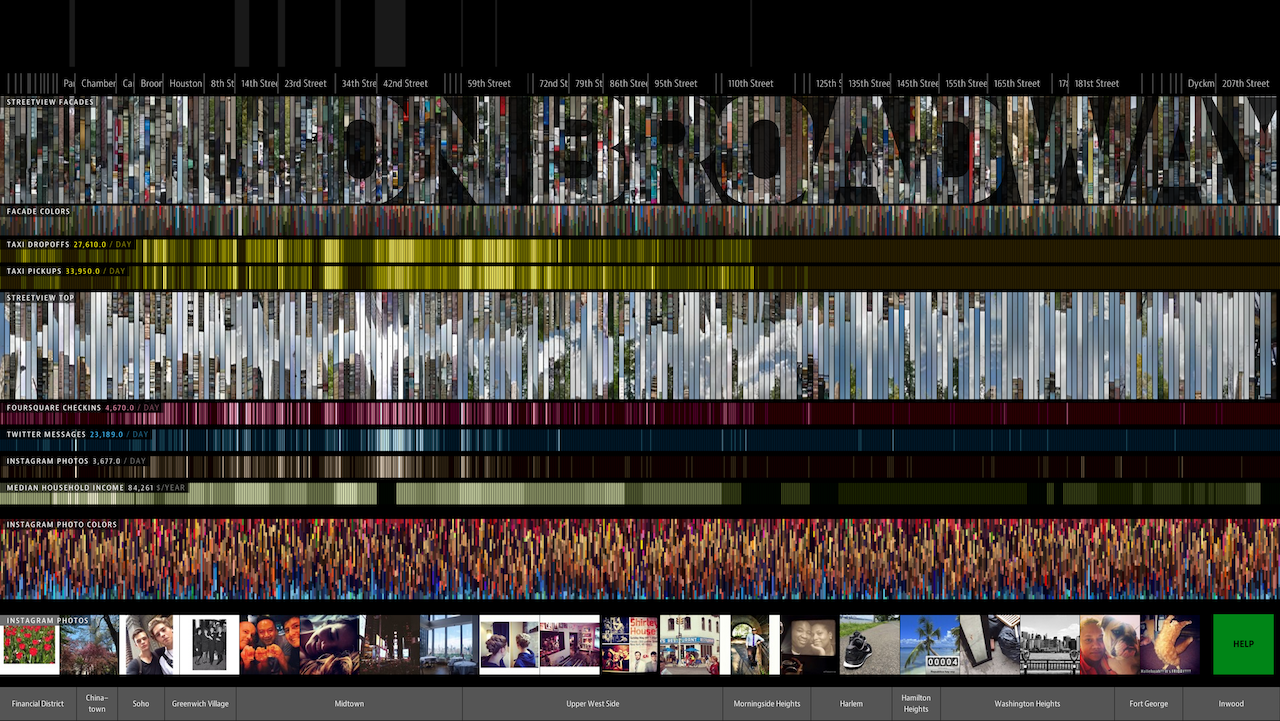
On Broadway
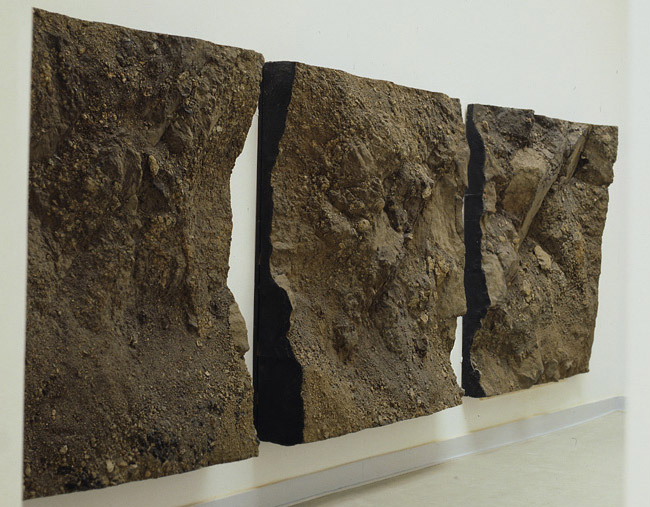
Boyle Family
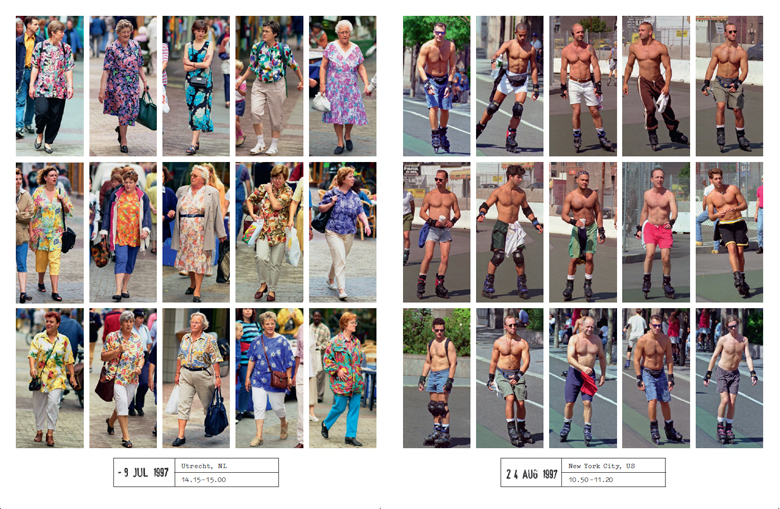
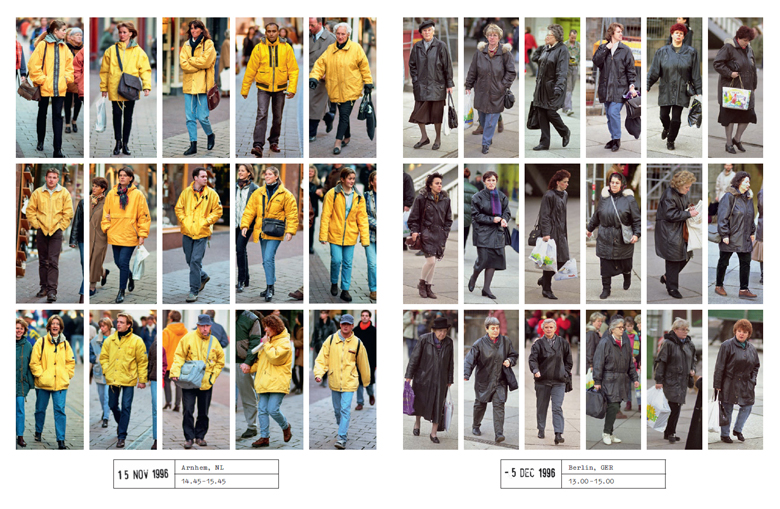
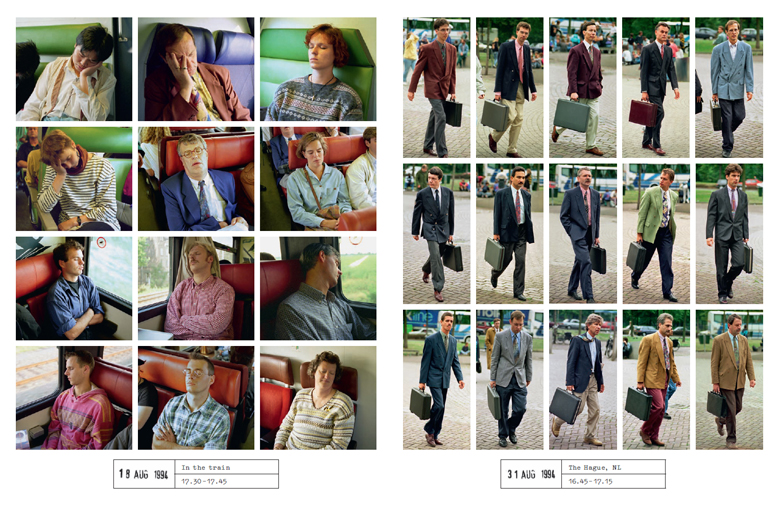
Hans Eijkelboom
WORKSHOP INTRODUCTION
You will work together in small teams. You will walk the area (street or neighbourhood) through the eyes of a data anthropologist. And you will try to collect useful data about your theme during the walk.
Data collection will take place through notes (pen and paper), pictures (mobile phones) and/or digital counting (via app or sensors/arduino). After the walks you will examine the data and how to visualise it in different forms and materials.
I will be on hand to assist you throughout, but you have freedom to work with a negotiated theme, how you would like to gather data and represent it.
This might be your first moment working with data, or you might be very experienced. You might be interested in particular issues, or for a technical aspect. Data Walking is a framework for people to engage with their surroundings and produce visual responses initiated by first hand data enquiry.
CONSIDERATION When deciding methods and materials, consider if they are appropriate to the theme, consider your expertise level and what you want to gain from the two days, consider the limited time frame. Personally it has been interesting to move from quantative to qualitive data gathering, using more pictures than numbers as source material.
TOOLS & MATERIALS
Arduino with GPS shield and sensors
Smartphones with GPS cameras, video, audio recorders
Pen, pencils, or any mark-making tools & paper
Playdough & modelling clay
Threads
Printers
Screens
Software
Mixed analog/digital
VISUAL REFERENCES
Phantom Terrain
Every Building on the Sunset Strip
On Broadway
Boyle Family
Hans Eijkelboom
BRIEF: RE-ENVISIONING UTRECHT
What can we learn about a place, not just by the quantity of something but the characteristics of that something?
It is not just that there is a lot of litter, but the type of litter that gives us insight into human activity.
Consider hyper-focused data gathering vs broad data gathering. With broad gathering (photography) we can target through visualisation but might lack the necessary detail, with hyper-focused (drawing/notes/sensors) we could miss something that is of greater interest.
Each team should decide together what they want to gather data on from the below themes. You may gather data on multiple themes and consider the interrelationship between different aspects.
THEMES
GREEN SPACES
amount, size, characteristics, usage, shadiness, openess
FLORA & FAUNA
amount, size, types, diversity
LITTER
amount, characteristics, litter bins
POLLUTION
air quality (perceived/measured), noise, visual
MESSAGING
amount, characteristics, signage, wayfinding, advertising, posters, flyposting, graffiti
SECURITY
amount, characteristics, cameras, fences, physical control measure, guards, bike locks
VEHICLES
amount, characteristics, type, cars, trucks, motorbikes, bikes, speed, traffic, stationary, parked, interactions, arguments/incidents
PEOPLE
amount, density, characteristics, occupation/usage
ARCHITECTURE
age, style, condition, characteristics, function, usage
CHALLENGE
AREA
SCHEDULE
DAY 1
1330: Project introduction & workshop briefing
1500: Team theme brainstorming (decide what and how)
1615: Walk 1
1715: Check data, evaluate method and results; consider how to create visualisation, sketch
1800: Social drink
DAY 2
0930: Recap, adjust methods, focus of theme, route; brainstorm visualisation, sketch
1000: Print photos LATCH exercise
1100: Walk 2
1200: Lunch
1300: Work in your teams to prepare a visualisation of your data/collection
1630: Presentations
1650: Thank you, and time for final questions