DATA WALKING TBILISI
INTRODUCTION
You will work together in small teams. You will walk the area (street or neighbourhood) through the eyes of a data anthropologist. And you will try to collect useful data about your theme during the walk.
Data collection will take place smartphone photography. After the walks you will examine the data and how to visualise it as an online map using Mapbox.
This might be your first moment working with data, or you might be very experienced. You might be interested in particular issues, or a technical aspect. As a group remember to accommodate the different experience and skill levels you each have, common and differing interests, and take this as an opportunity to learn from and with one another.
Data Walking is a framework for people to engage with their surroundings and produce visual responses initiated by first hand data enquiry. For this workshop you must maintain an open, inquisitive, and scientific mind; with a willingness to experiment with how to gather data and how to visualise data.
VISUAL REFERENCES
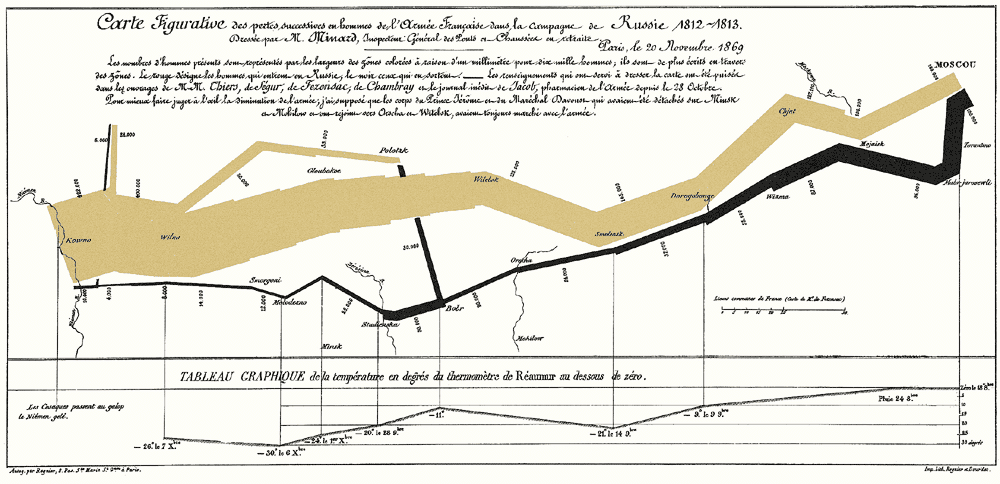
Napolean's Retreat — Joseph Charles Minard
Phantom Terrain — Stefanie Posavec, Frank Swain, Daniel Jones
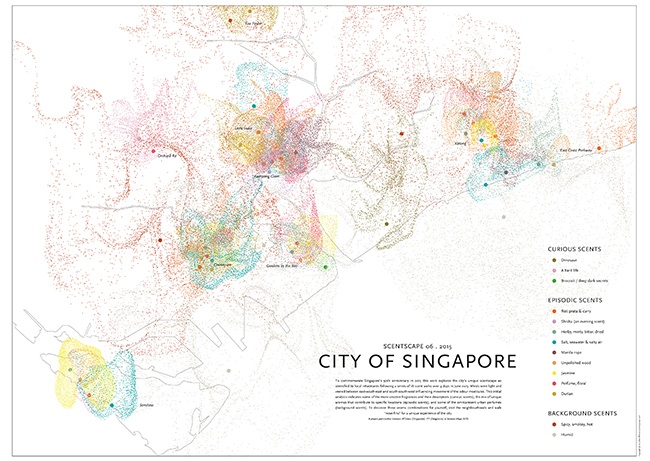
Smell Maps — Kate McLean
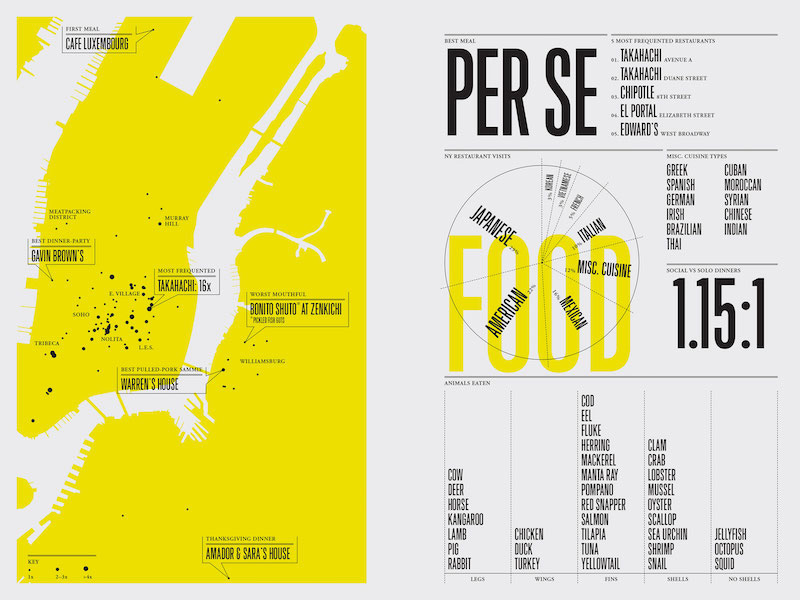
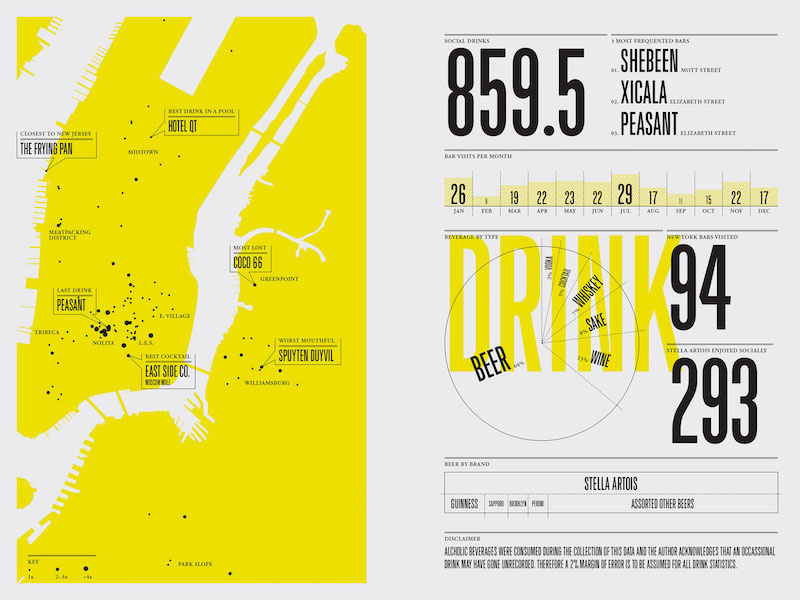
Feltron — Nicholas Felton
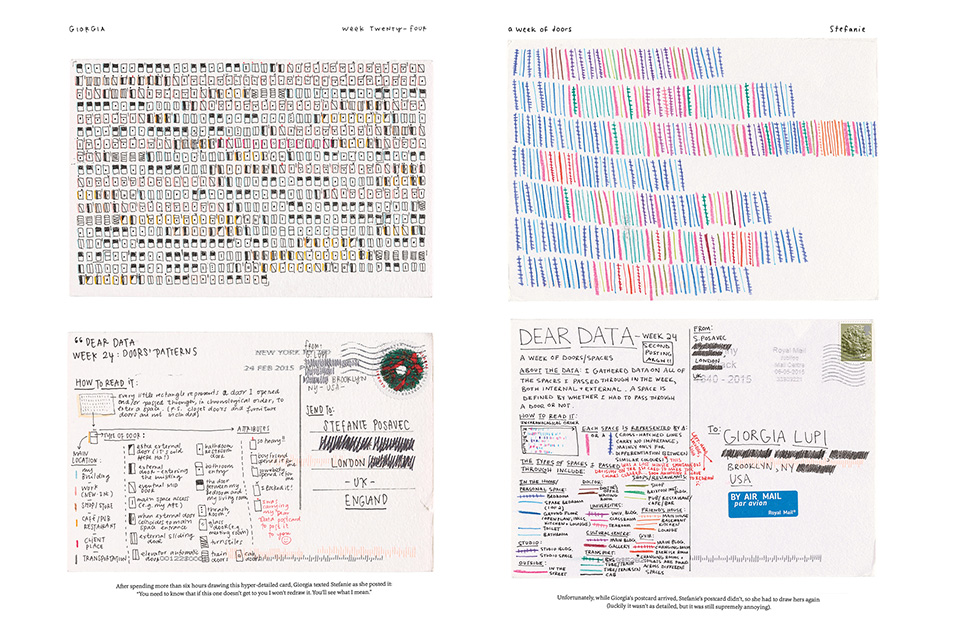
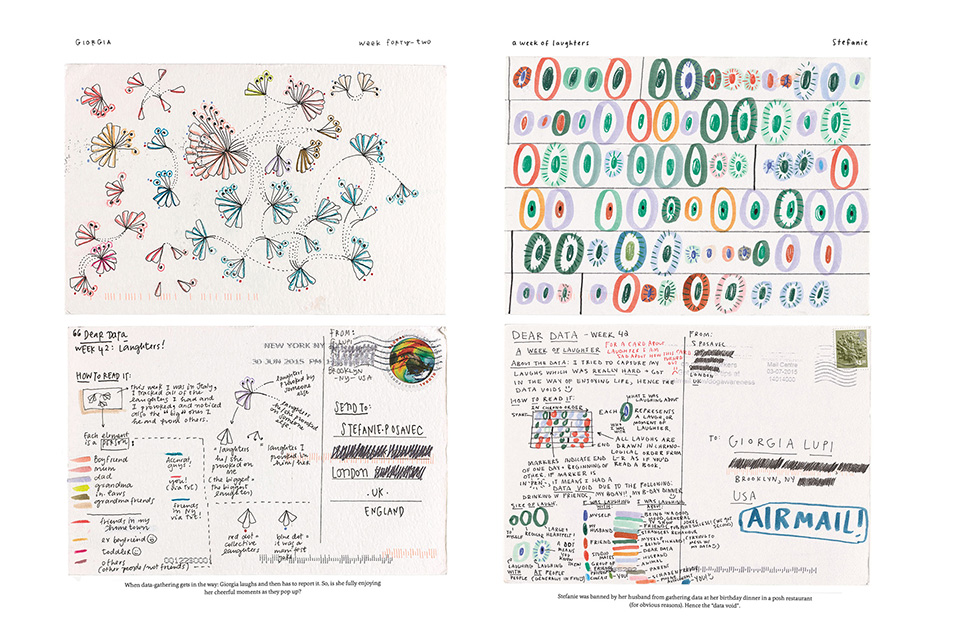
Dear Data — Stefanie Posavec & Giorgia Lupi
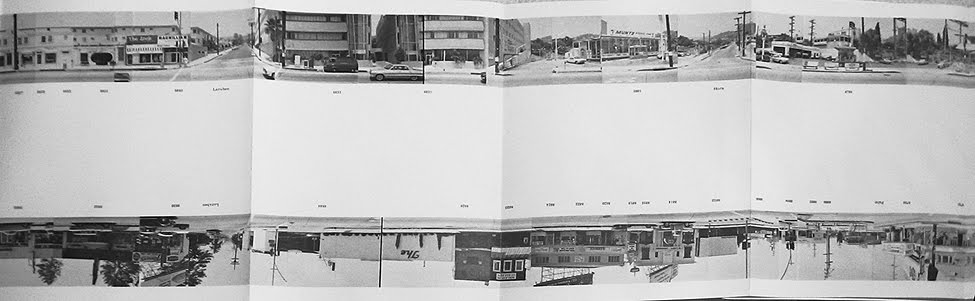
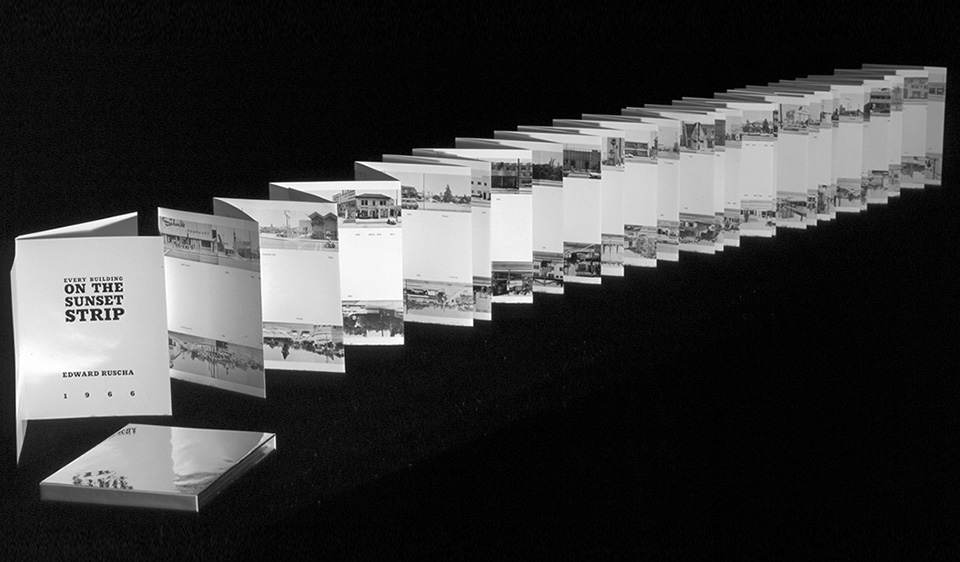
Every Building on the Sunset Strip — Ed Ruscha
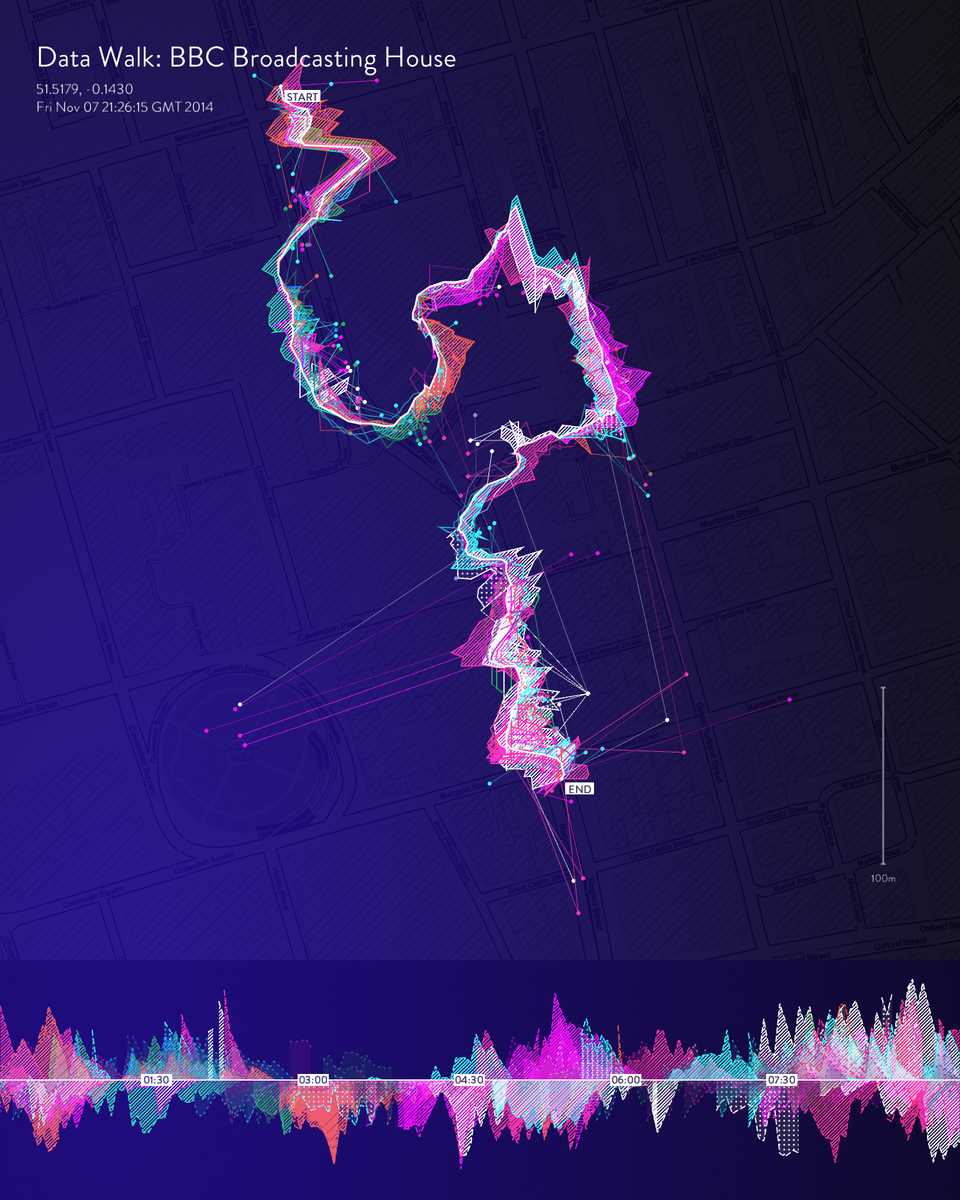
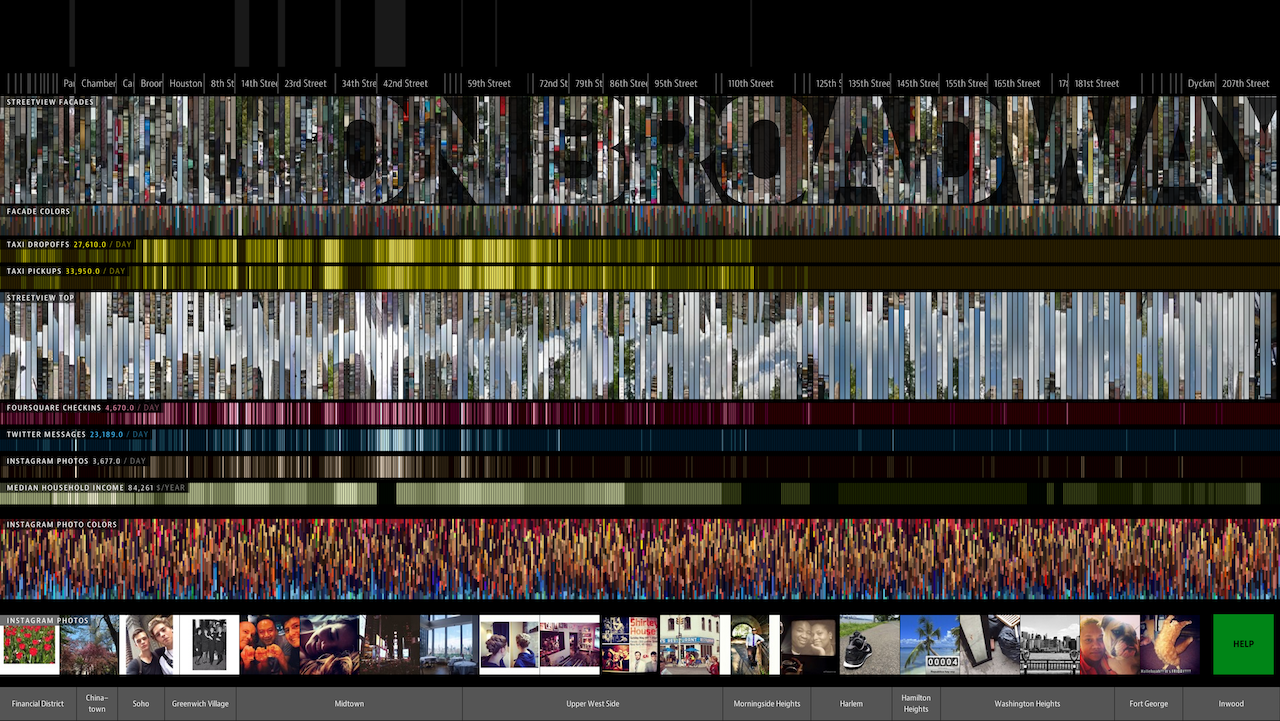
On Broadway — Daniel Goddemeyer, Moritz Stefaner, Dominikus Baur, and Lev Manovich
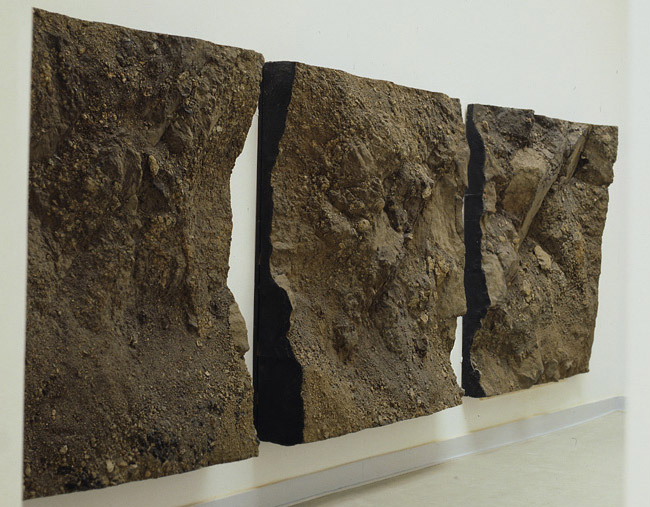
Boyle Family
Steve McPherson
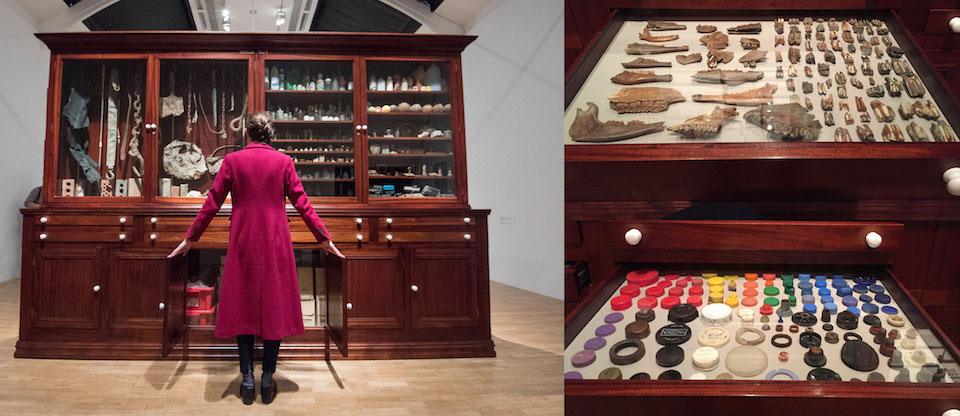
Mark Dion
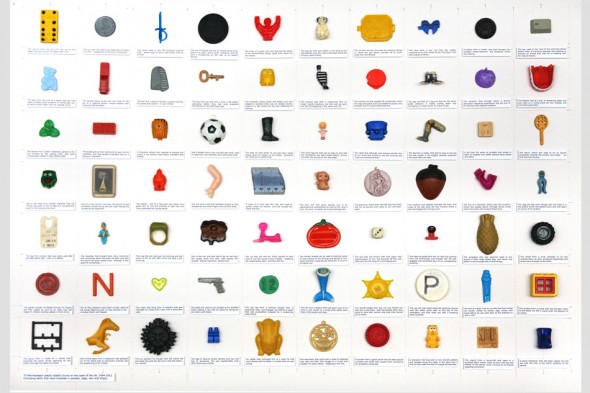
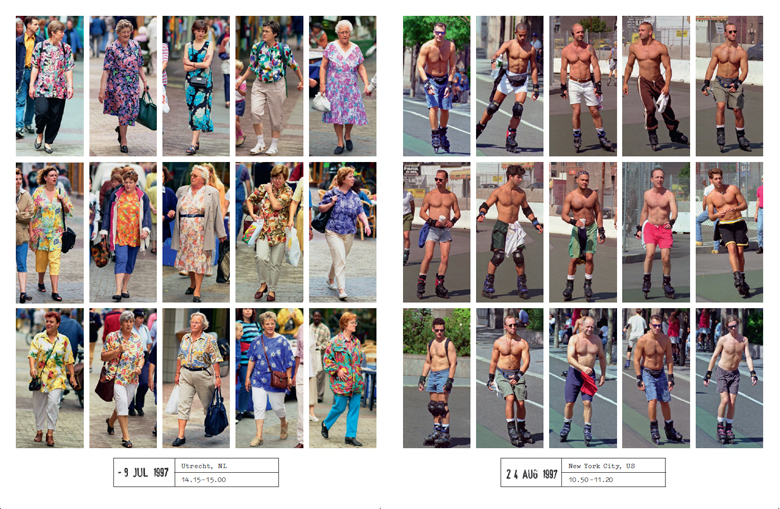
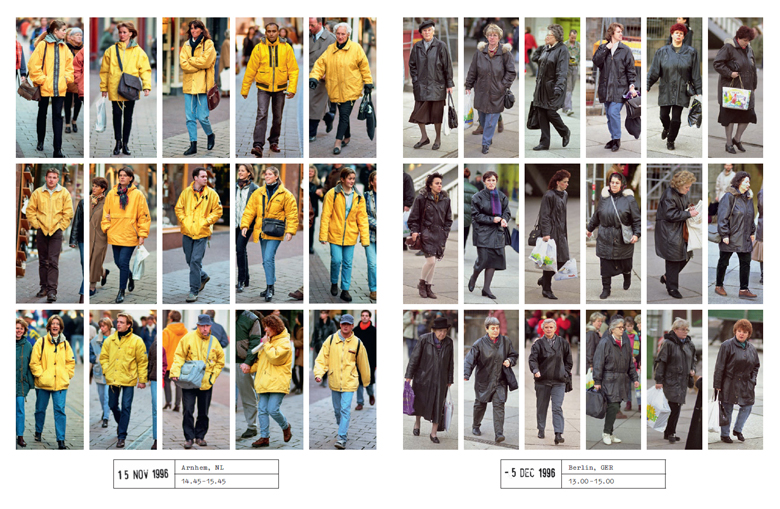
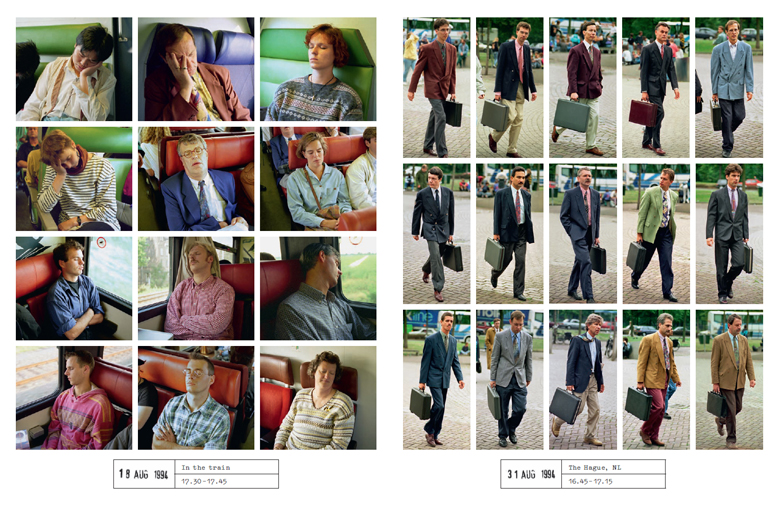
Hans Eijkelboom
 Neubau Forst — Various

Notice that although these are presented as designed visualisations, almost all of them have gathered their own data.
BRIEF: DUALITY
Working in pairs, consider the below charactaristics of the city. Think of them in terms of a duality, a split, divide, opposites, or perhaps positive/negative attributes. For example old/new buidlings, busy/empty streets, fast/slow cars, happy/angry people.
It is possible to do this in trios as well if required. For example silent/regular/noisy areas, 0-10/11-20/21+ people at a street crossing.
It is also possible to do it solo (I'd advise against that). For example record the presence of roadworks.
CONSIDERATIONS
Consider hyper-focused data gathering vs broad data gathering. With broad gathering (photography) we can target particular variables/trends through visualisation but might lack the necessary detail, with hyper-focused (drawing/notes/sensors) we could miss something that is of greater interest.
Each team should decide together what they want to gather data on from the below themes. You may gather data on multiple themes and consider the interrelationship between different aspects.
PLEASE MAKE SURE YOUR YOUR PHONE HAS LOCATION SERVICES SWITCHED ON!
THEMES
GREEN SPACES
amount, size, characteristics, usage, shadiness, openess
FLORA & FAUNA
amount, size, types, diversity
LITTER
amount, characteristics, litter bins
POLLUTION
air quality (perceived/measured), noise, visual
MESSAGING
amount, characteristics, signage, wayfinding, advertising, posters, flyposting, graffiti
SECURITY
amount, characteristics, cameras, fences, physical control measure, guards, bike locks
VEHICLES
amount, characteristics, type, cars, trucks, motorbikes, bikes, speed, traffic, stationary, parked, interactions, arguments/incidents
PEOPLE
amount, density, characteristics, occupation/usage
ARCHITECTURE
age, style, condition, characteristics, function, usage
SCHEDULE
14/11/2019
1400: Project introduction & workshop briefing
1430: Team forming and theme brainstorming (decide what to gather data on and your duality)
1500: Walk!
1600: Return and work with Mapbox
1730: Wrap up and thank you!
EXTRACTING DATA & MAPBOX
1 Transfer images from phone to your laptop (one folder per dataset)
2 Download Exiftool
OPTION 1 - SIMPLE
1 Use Exiftool to extract GPS data from photos and generate CSV file
OPTION 2 - SPREADSHEETS
1 Use Exiftool to extract GPS data from photos and generate CSV file
2 Open CSV file in text editor or spreadsheet program
3 Add data values
4 Merge both files into one CSV file
MAPBOX
1 Make Mapbox account
2 Create Dataset
3 Export to Tileset
4 Create style and import tileset(s)
5 Style data points
6 If you followed option 2 then you can style the data point based on the value or a condition
7 Make Tileset public and share
8 Make a map of Tbilisi with all the datapoints gathered by the group, looking for trends and outliers
AREA