DATA WALKING:
PATHS THROUGH PATRAS
INTRODUCTION
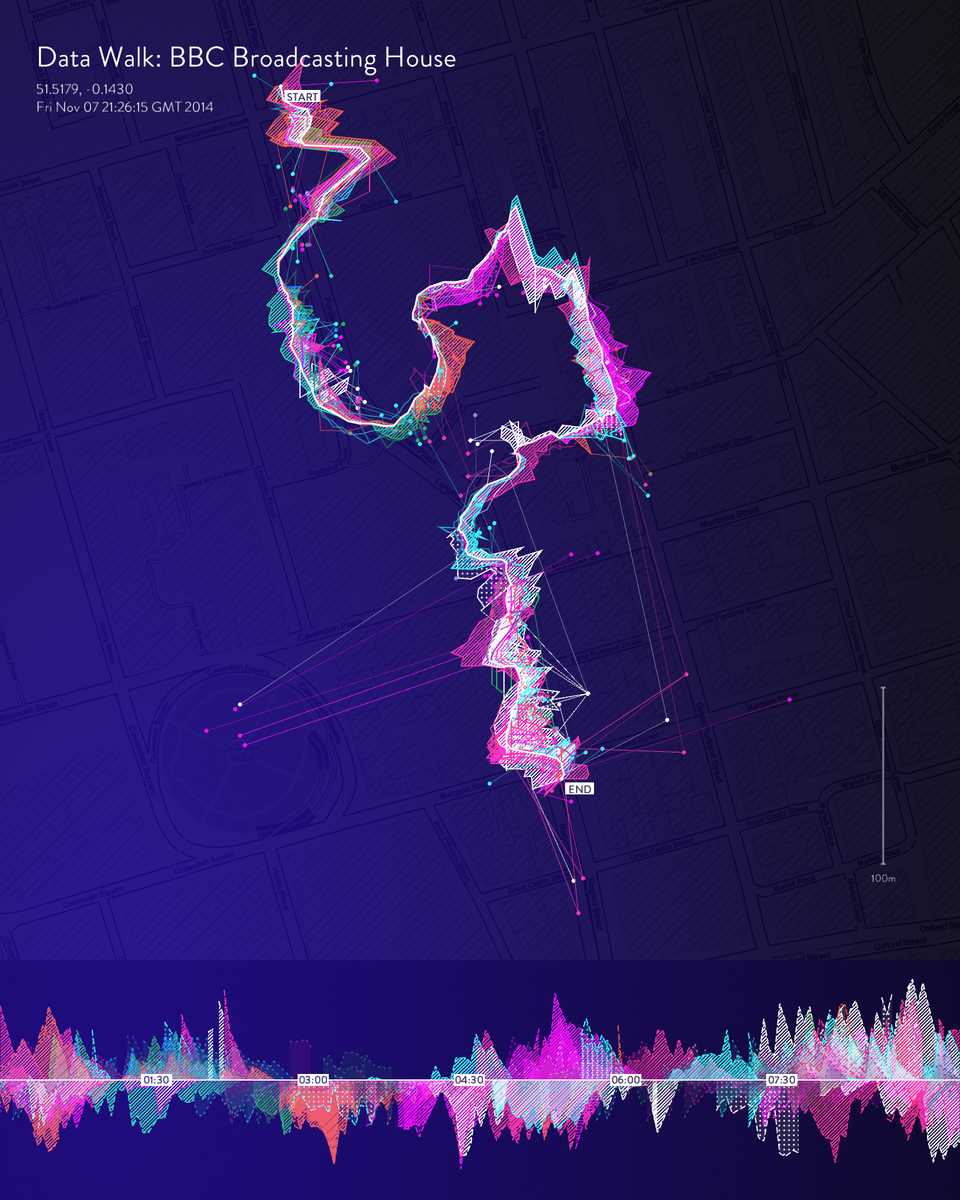
Data Walking is a research project exploring the potential of walking to gather environmental data and then through visualisations build a rich picture of that area, gain insight, and share knowledge.
In this workshop we will work together in pairs or small teams. We will walk Patras with the eyes of a data anthropologist, and we will try to collect useful data about a theme during the walk.
Data collection will take place through notes (pen and paper) and pictures (mobile phones). After the walks we will examine the data and how to visualise it in different forms.
This might be your first moment working with data, or you might be very experienced. You might be interested in particular issues, or a technical aspect. As a group remember to accommodate the different experience and skill levels you each have, common and differing interests, and take this as an opportunity to learn from and with one another.
Data Walking is a framework for people to engage with their surroundings and produce visual responses initiated by first hand data enquiry. For this workshop you must maintain an open, inquisitive, and scientific mind; with a willingness to experiment with how to gather data and how to visualise data.
WHAT IS DATA?
Data is facts and statistics collected for reference or analysis.
Data is a set of values of quantitative or qualitative variables.
Field data is raw data that is collected in an uncontrolled "in situ" environment.
Examples of data include:
- Numbers
- Words
- Drawings, impressions
- abstract notation
- Photographs
Data is measured, collected and reported, and analysed, whereupon it can be visualized through charts other analysis tools.
WHAT IS DATA VISUALISATION?
The representation of information in the form of a chart, diagram, picture, etc.
Data visualization refers to the techniques used to communicate data or information by encoding it as visual objects (e.g., points, lines or bars) contained in graphics. The goal is to communicate information clearly and efficiently to users.
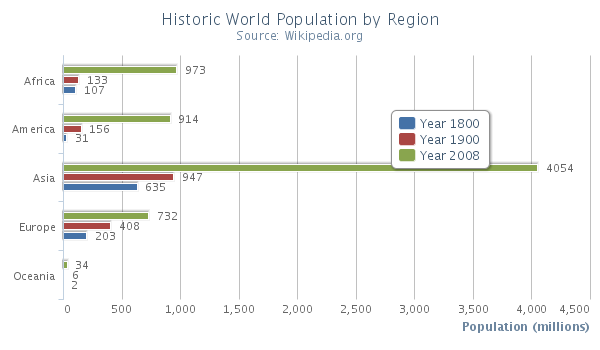
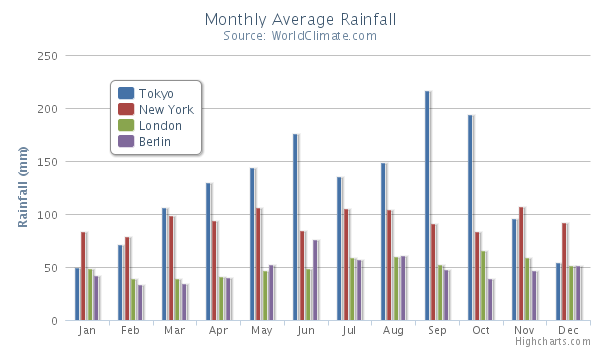
BAR & COLUMN CHART
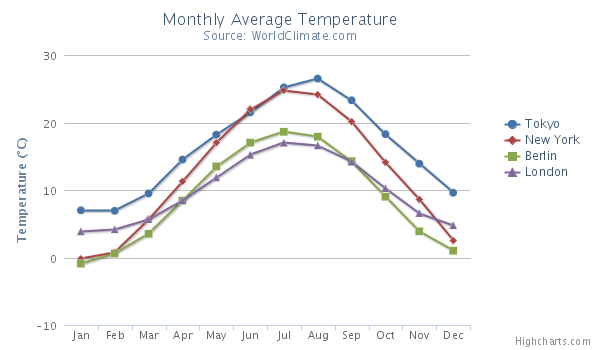
LINE GRAPH
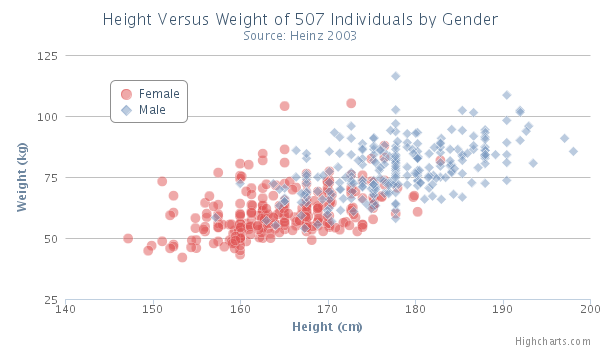
SCATTER PLOT
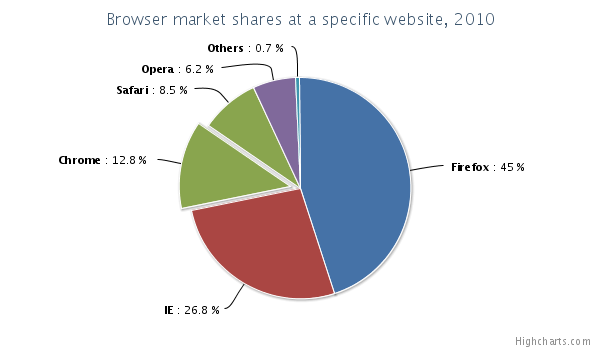
PIE CHART
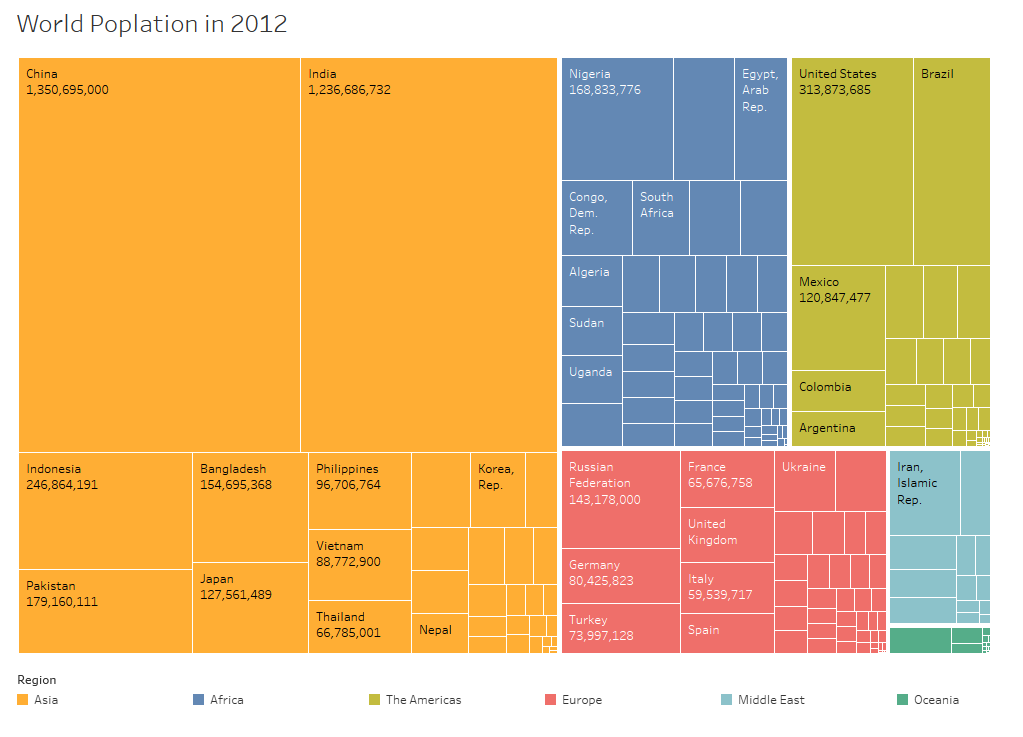
TREE MAP
VISUAL REFERENCES
Napolean's Retreat
Phantom Terrain
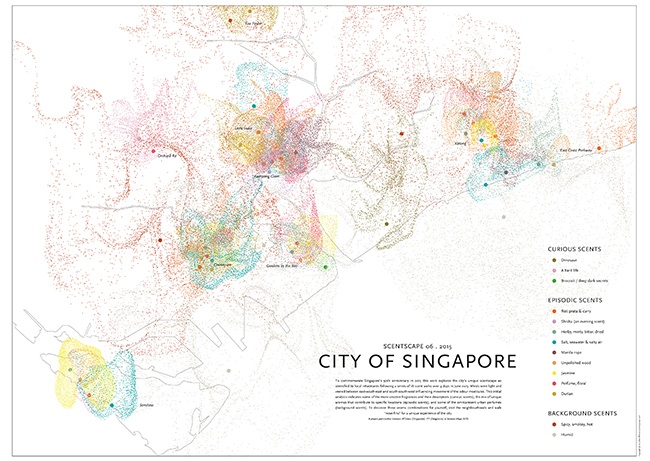
Smell Maps
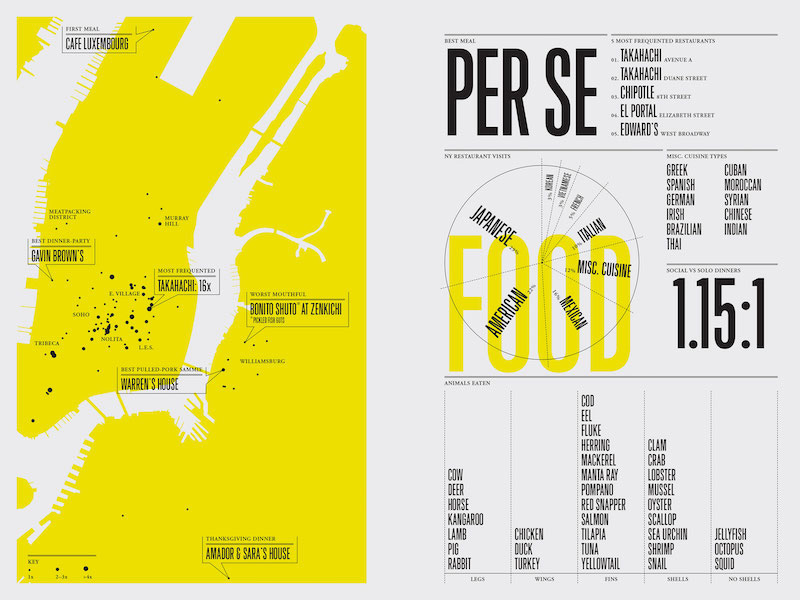
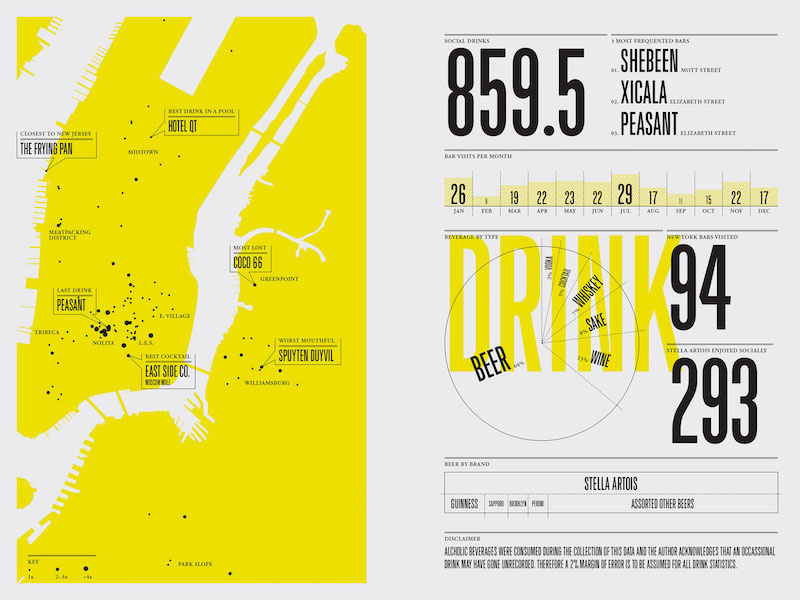
Feltron
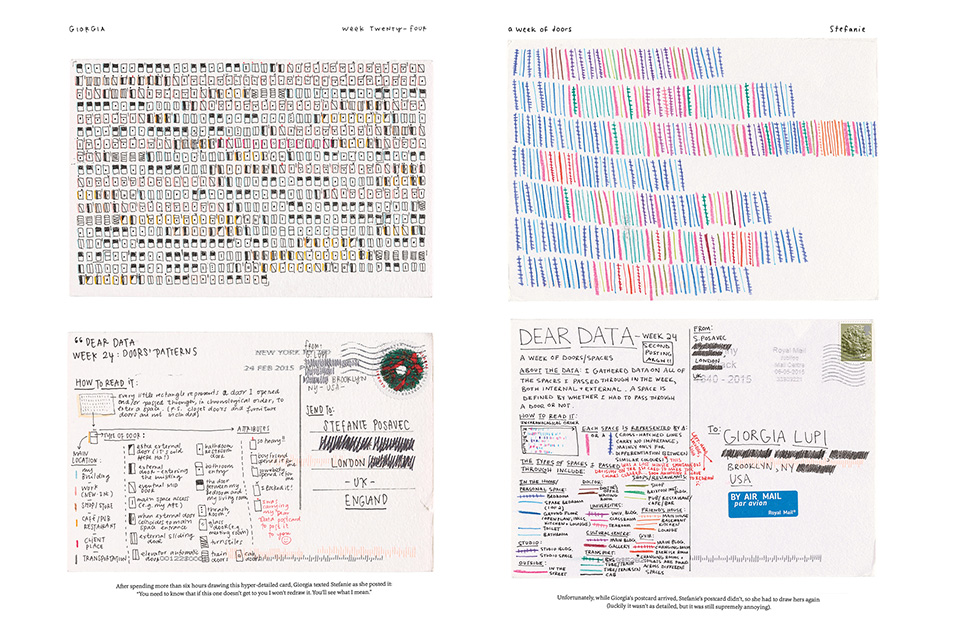
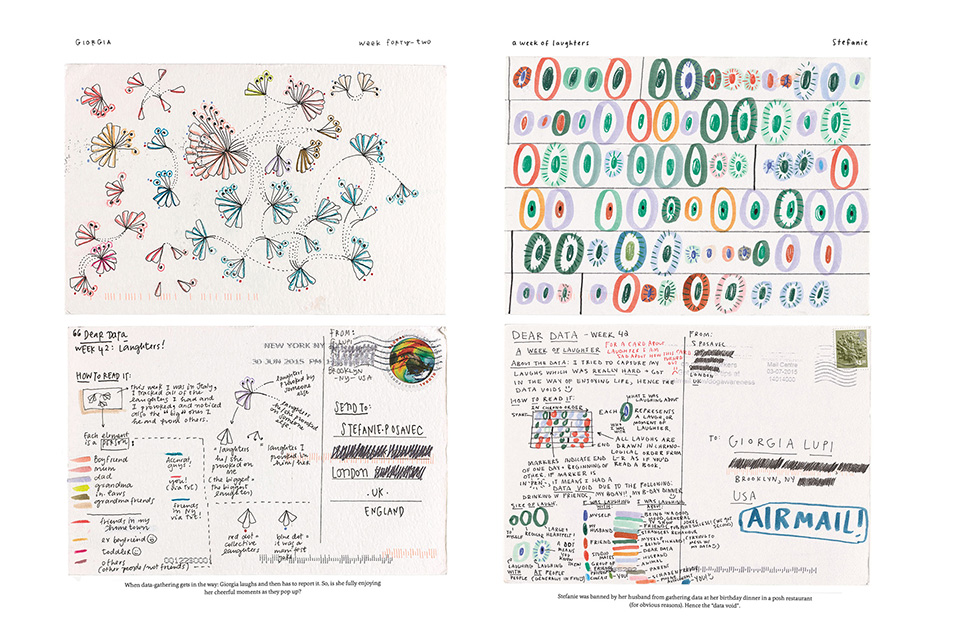
Dear Data
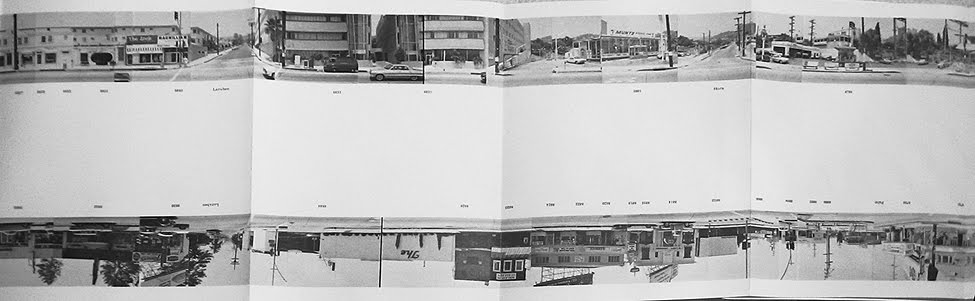
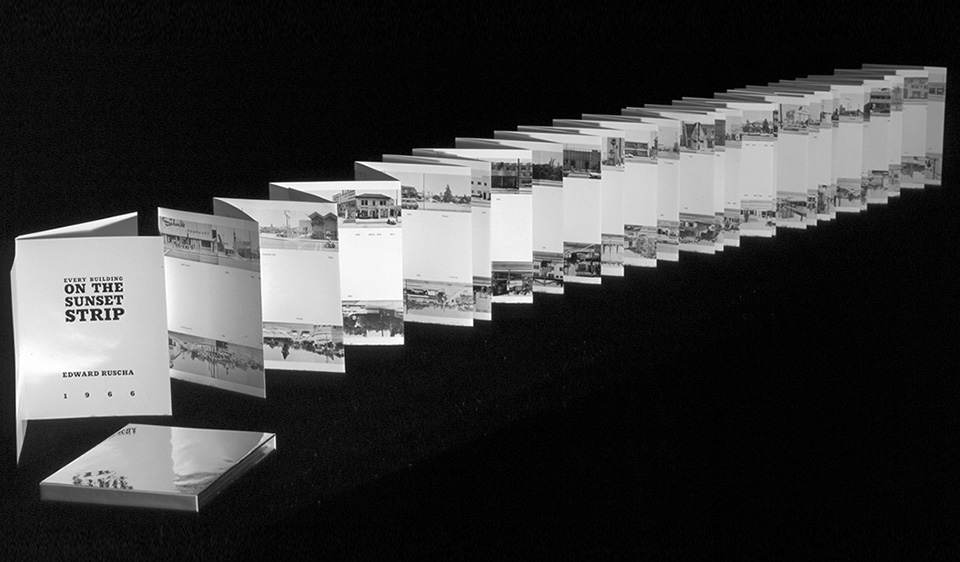
Every Building on the Sunset Strip
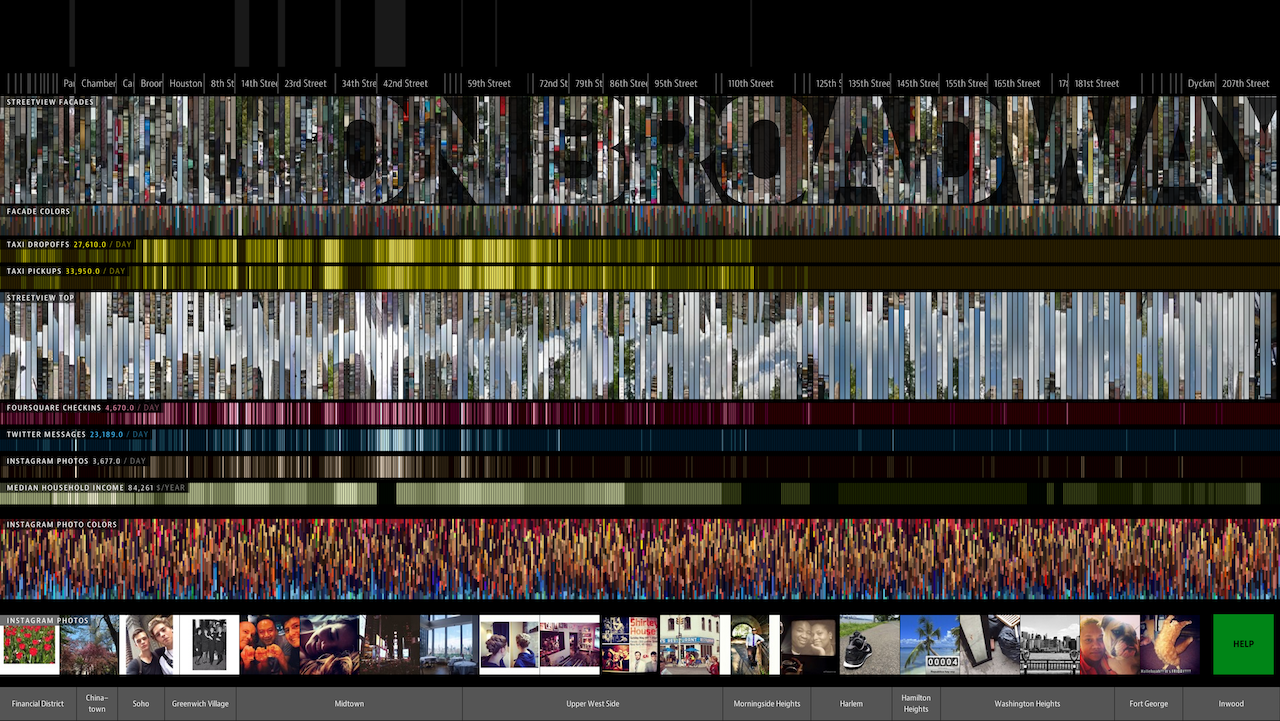
On Broadway
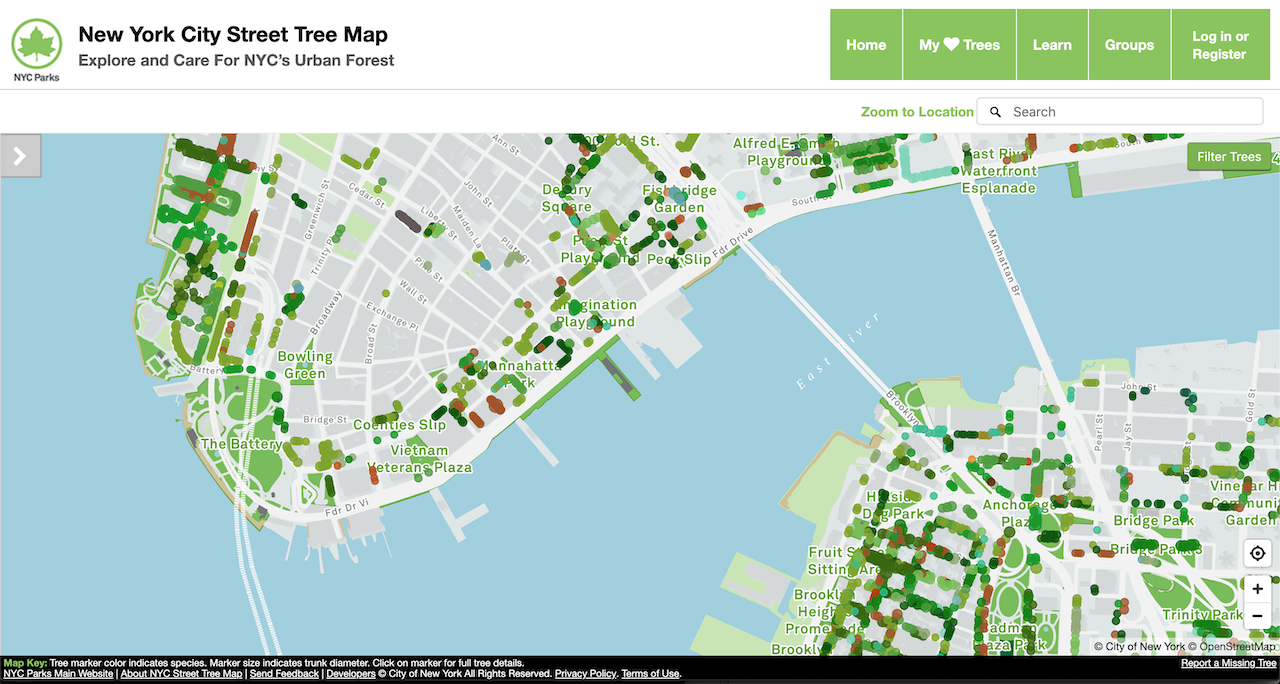
NYC Trees
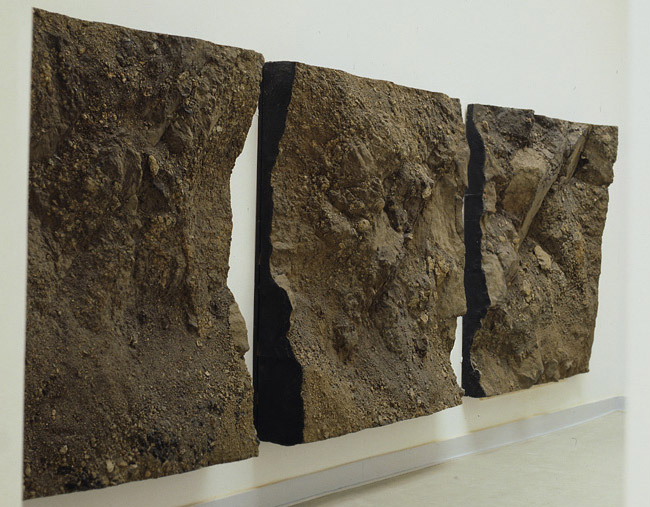
Boyle Family
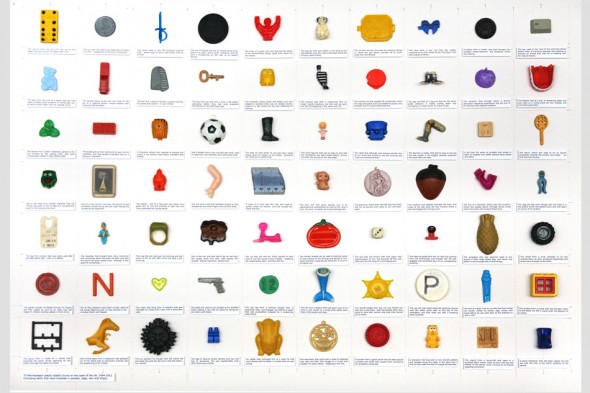
Steve McPherson
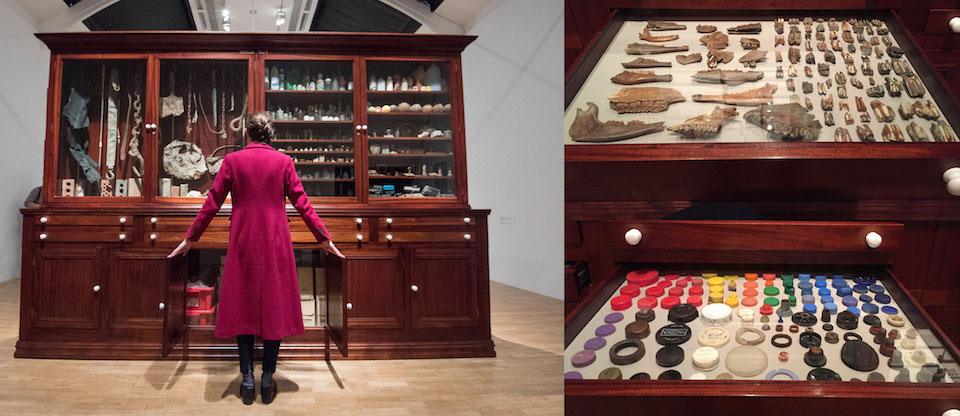
Mark Dion
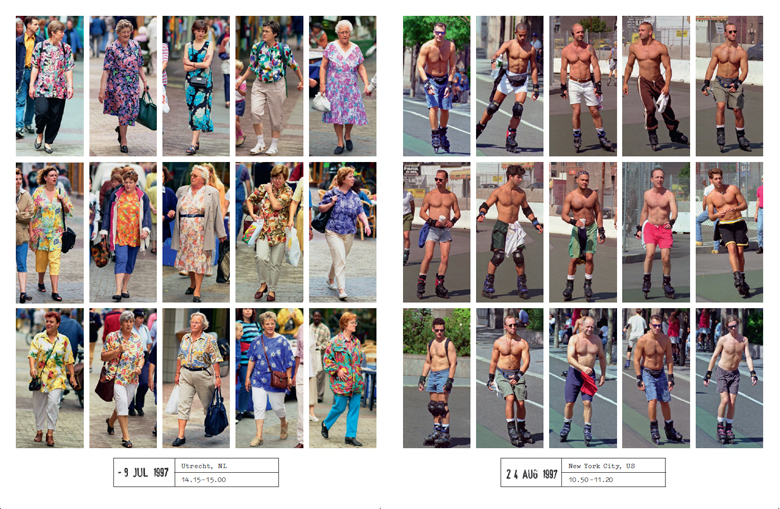
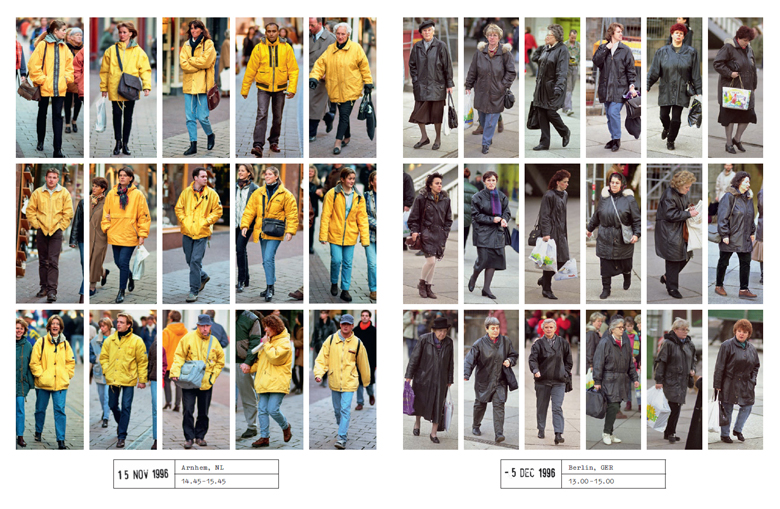
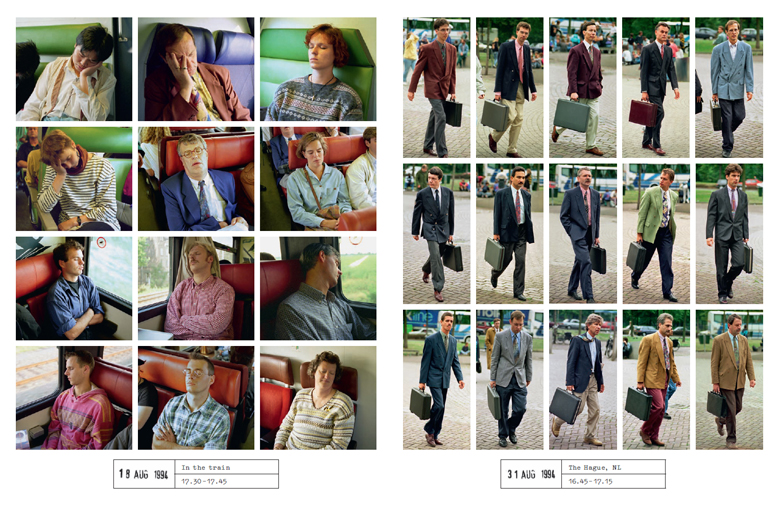
Hans Eijkelboom
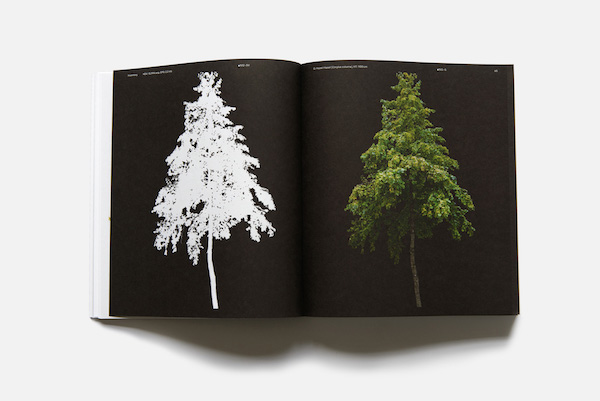
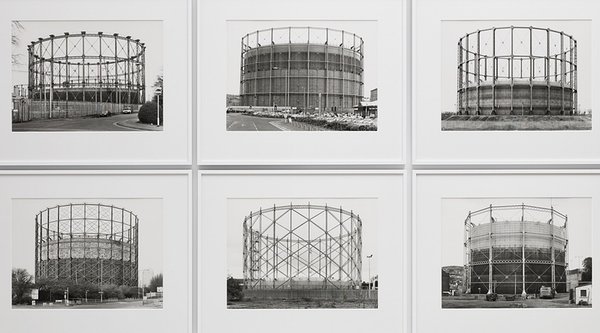
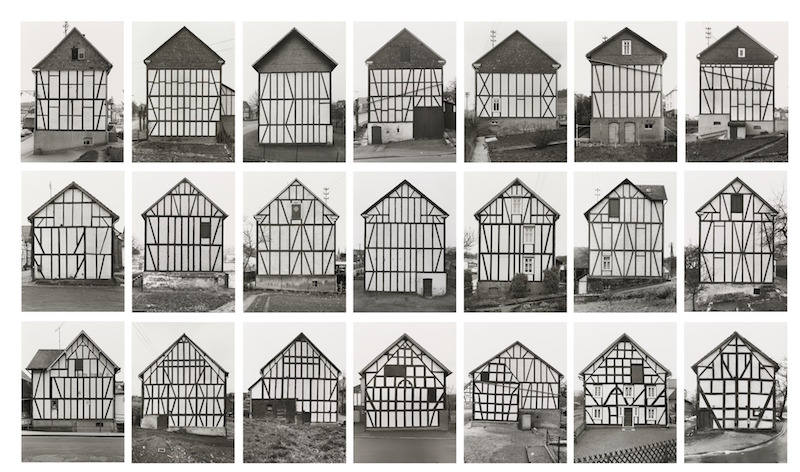
 Neubau Forst

Notice that although these are presented as designed visualisations, almost all of them have gathered their own data.
BRIEF
During the walk and over the day, what can we learn about a place, not just by the quantity of something but the characteristics of that something?
It is not just that there is a lot of litter in a place, but the type of litter that gives us insight into human activity.
- Note-taking is an easy way to capture quantities and qualities
- Smartphone photography can capture characteristics and location
- Consitency is important in capturing data
CONSIDERATIONS
How focused should we be in what we gather data on? If we are too focused do we miss something else interesting, if we are too broad do we lack the detail to make interesting insights?
When deciding an approach and method, is it appropriate to the theme, time frame, and what you want to gain from the workshop?
Each team should decide together what theme they want to gather data on and how. You may gather data on multiple themes and consider the interrelationship between different aspects.
TOOLS
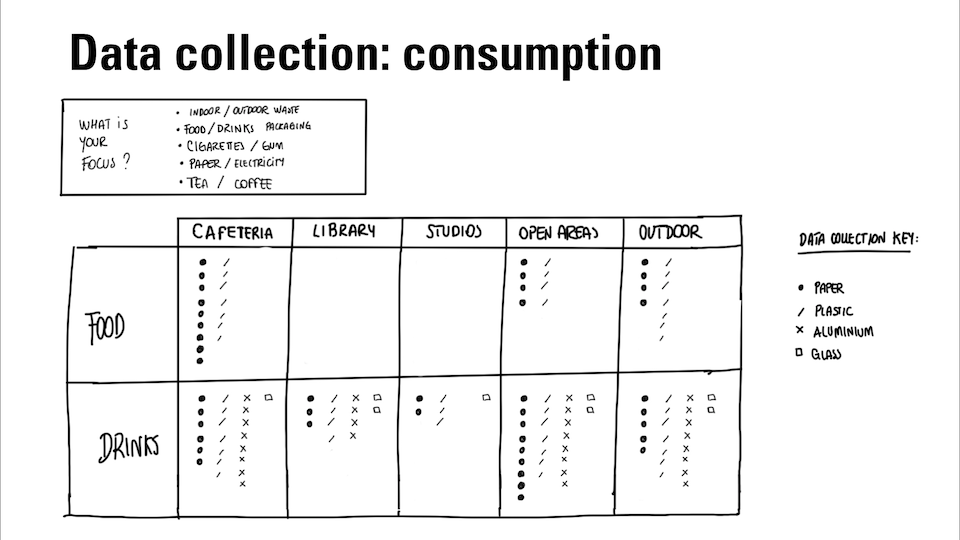
MARK MAKING
Drawings, measurements, abstract mark making, notations, counts, words, quantities and qualities

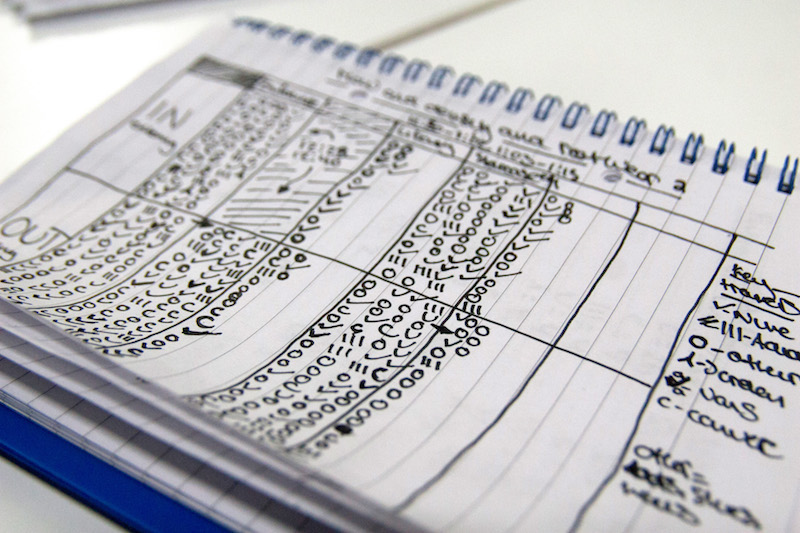
Consider scope and consistancy of:
- what are you looking for and what do you expect to see?
- how to categorize?
- what other attributes can you gather data on?
- how to score/value? numbers: measurements/subjective scores, words: descriptions/feelings
- note time and location
- what is your notation system/table structure?
PHOTOGRAPHY
Take photos with a smartphone
Consider consistancy of:
- portrait or landscape?
- distance and angle to subject
- multiple angles?
- lighting
- Video?
- Tech tip: turn on location services for GPS data
- Consider a time interval?
COMBINATION
Use photos as a button to capture GPS of notation point
THEMES
GREEN SPACES
amount, size, characteristics, usage, shadiness, openess
FLORA & FAUNA
amount, size, types, diversity
LITTER
amount, characteristics, litter bins
POLLUTION
air quality (perceived/measured), noise, visual
MESSAGING
amount, characteristics, signage, wayfinding, advertising, posters, flyposting, graffiti
SECURITY
amount, characteristics, cameras, fences, physical control measure, guards, bike locks
VEHICLES
amount, characteristics, type, cars, trucks, motorbikes, bikes, speed, traffic, stationary, parked, interactions, arguments/incidents
PEOPLE
amount, density, characteristics, occupation, behaviour
ARCHITECTURE
age, style, condition, characteristics, function, usage
CHALLENGE
- What is of interest to you? (themes/tools/outcomes?)
- What do you want to know about this area? Something specific/generic to a city?
- What might be of value to the people of the area and the authorities?
SCHEDULE
START
0900: Meet and walk to the venue
0930: Project introduction & workshop briefing
1000: Teams & Themes: deciding what to gather data on and how
1100: Walk!
1200: LATCH/Lunch
1300: Lunch/LATCH
PATH 1
1400: Prototype visualisations (pen & paper/software) examining:
- Magnitude
- Part-to-whole
- Correlation
- Distribution
- Change-over-time
- Spatial
PATH 2
1400: Create data-driven interactive maps with Mapbox
- Process photos with Exiftool to extract GPS data
- Add analysed data to spreadsheet in Google Sheets
- Convert data to geojson
- Create dataset & tileset in Mapbox
- Load data into map
- Style data and map design
END
1700: Quick presentations of outcomes and time for final questions
AREA