INTRODUCTION
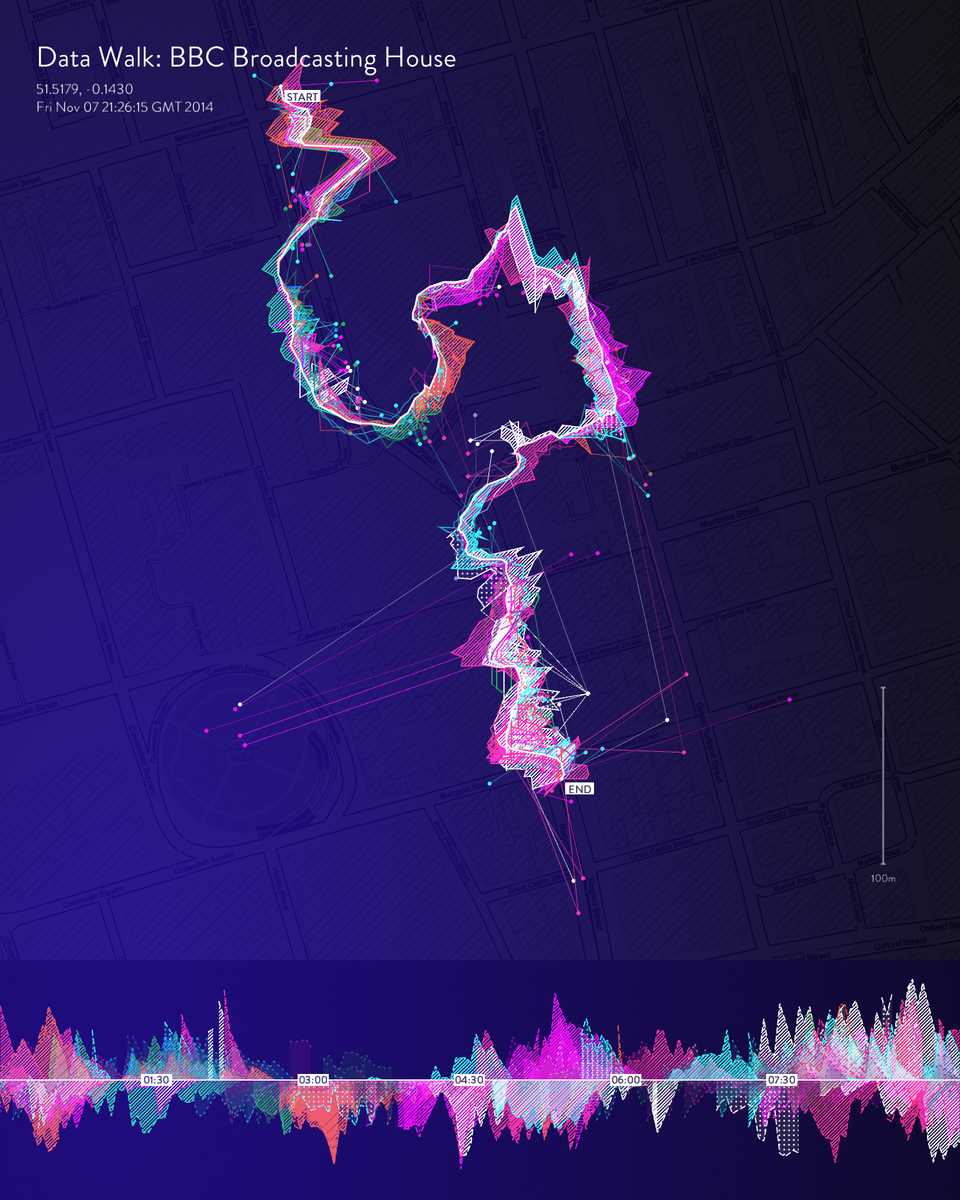
Data Walking is a research project exploring the potential of walking to gather environmental data and then through visualisations build a rich picture of that area, gain insight, and share knowledge.
Data Walking is a framework for people to engage with their surroundings and produce visual responses initiated by first hand data enquiry. For this workshop you must maintain an open, inquisitive, and scientific mind; with a willingness to experiment with how to gather data and how to visualise data.
This might be your first moment working with data, or you might be very experienced. You might be interested in particular issues, or a technical aspect. As workshop members remember to accommodate the different experience and skill levels of each other, common and differing interests, and take this as an opportunity to learn from and with one another.
Bringing together people from different perspectives, backgrounds, and locations is what makes participatory design interesting. A local/remote combined workshop will be an exciting occasion!
In this workshop data collection will take place through pictures (mobile phones) and notes (pen and paper). After the walks we will extract and examine data and visualise it on a map.
WHAT IS DATA?
Data is facts and statistics collected for reference or analysis. Data is a set of values of quantitative or qualitative variables. Data can be encoded (and decoded). Field data is raw data that is collected in an uncontrolled "in situ" environment.
Examples of data include:
Numbers
Words
Drawings, impressions
abstract notation
Photographs
Data is measured, collected and reported, and analysed, whereupon it can be visualized through charts other analysis tools.
WHAT IS DATA VISUALISATION?
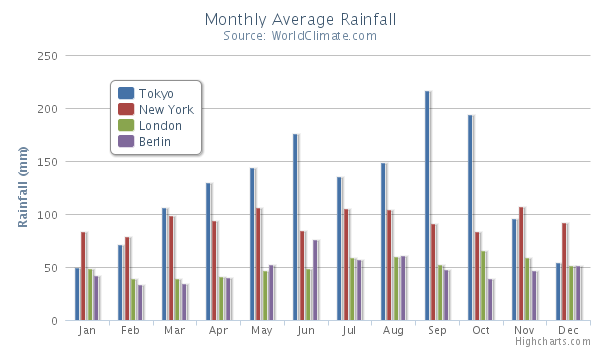
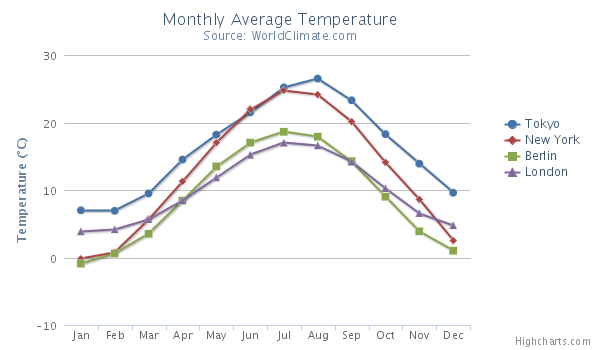
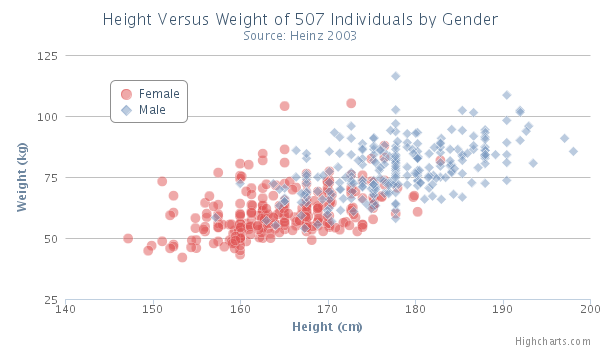
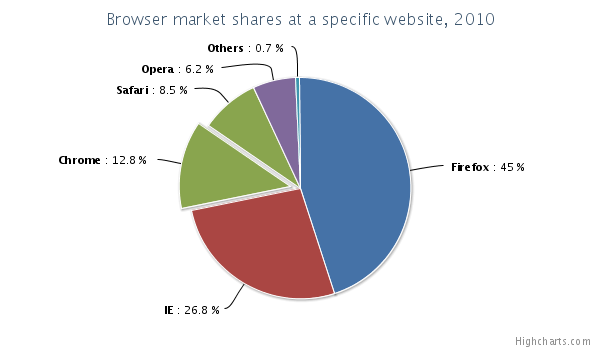
The representation of information in the form of a chart, diagram, map, picture, etc.
Data visualization refers to the techniques used to communicate data or information by encoding it as visual objects (e.g., points, lines or bars) contained in graphics. The goal is to communicate information clearly and efficiently to users.
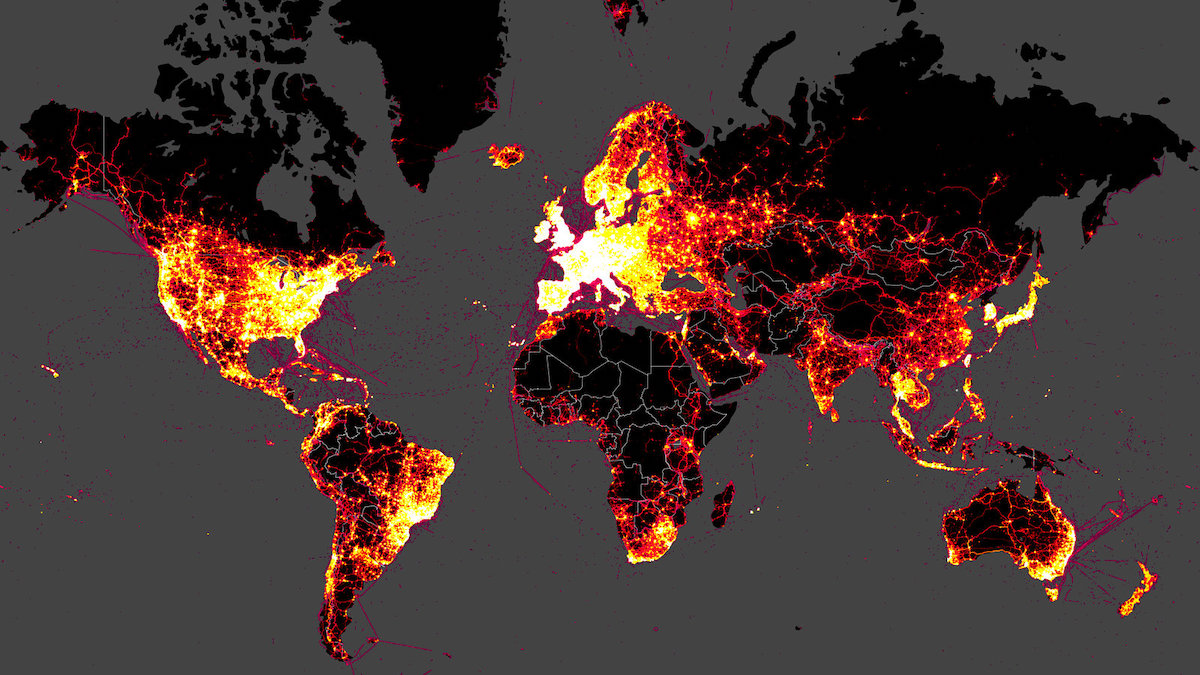
BAR & COLUMN CHART LINE GRAPH SCATTER PLOT PIE CHART MAP
In this workshop we will explore our local city/area. You will define themes, establish data gathering techniques, walk the city gathering data, and then learn how to create interactive online data-driven maps.
Through multiple participants and perspectives we aim to build multiple and diverse understandings of the urban environments we walked.
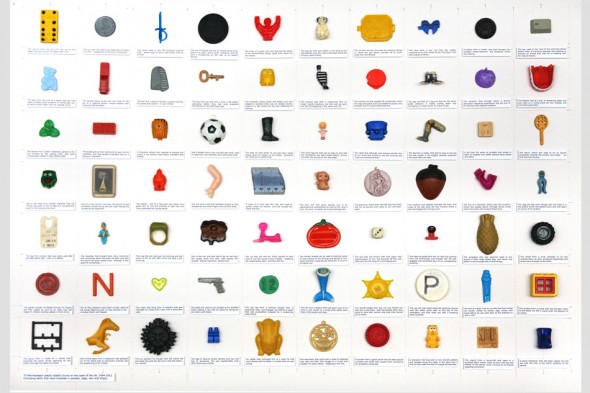
During the walk and over the day, what can we learn about a place, not just by the quantity of something but the characteristics of that something? For example, it is not just that there is a lot of litter in a place, but the type of litter that gives us insight into human activity.
Smartphone photography can capture characteristics and location
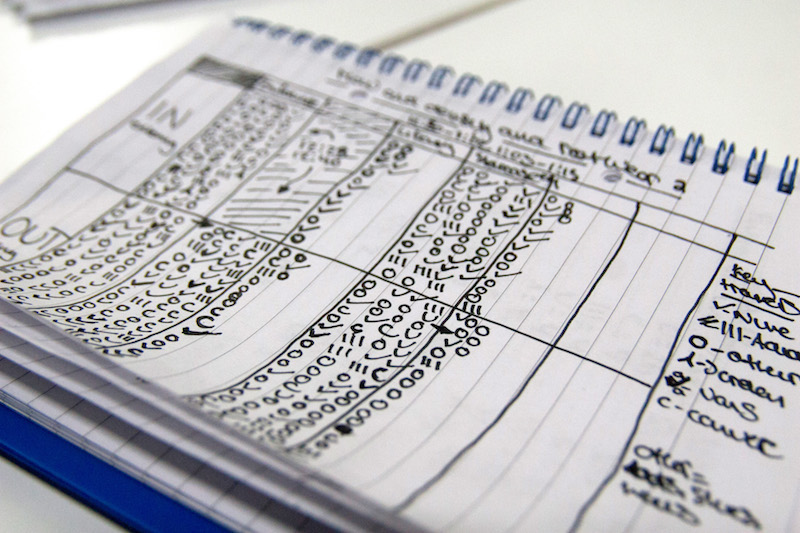
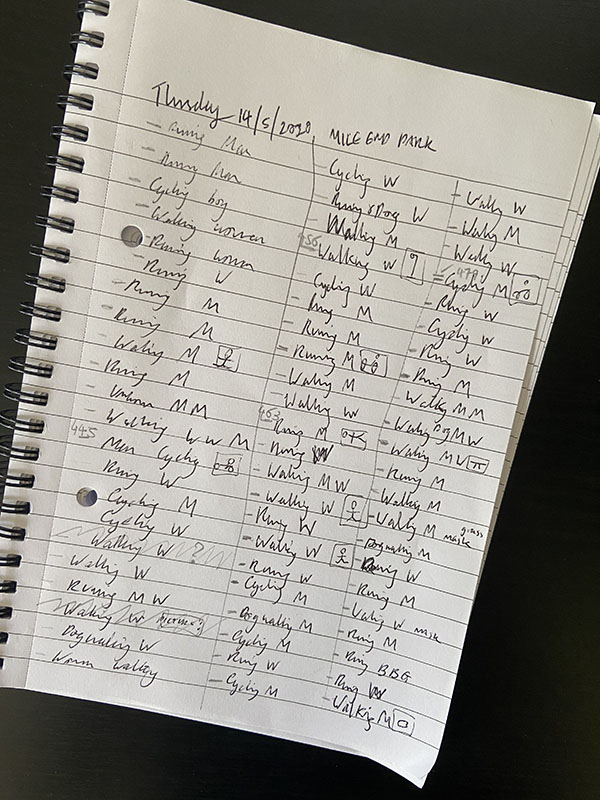
Note-taking is an easy way to capture quantities and qualities
Consitency is important in capturing data
CONSIDERATIONS
How focused should we be in what we gather data on? If we are too focused do we miss something else interesting, if we are too broad do we lack the detail to make interesting insights?
When deciding an approach and method, is it appropriate to the theme, time frame, and what you want to gain from the workshop?
You may gather data on multiple themes and consider the interrelationship between different aspects.
Please do not break any local rules imposed by quarantine or lockdown! Your health & wellbeing is more important than the workshop!
THEMES INSPIRATION GREEN SPACES
amount, size, characteristics, usage, shadiness, openess
FLORA & FAUNA
amount, size, types, diversity
LITTER
amount, characteristics, litter bins
POLLUTION
air quality (perceived/measured), noise, visual
What is of interest to you? (themes/tools/outcomes?)
What do you want to know about this area? Something specific/generic to a city?
What might be of value to the people and administrators of the area?
TOOLS
PHOTOGRAPHY 📸 📱 🤳
Take photos with a smartphone
Method Options
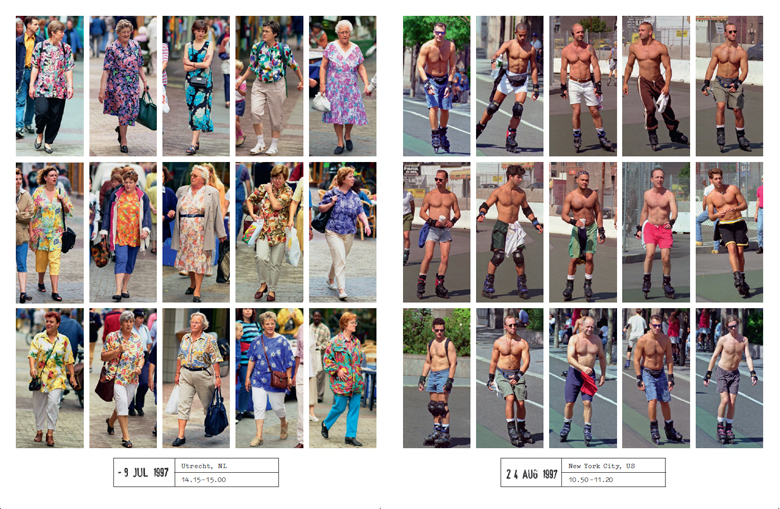
Take photos of every instance of a thing you see (your perspective) and capture multiple instances in a single photo.
Take a photo of every single instance (your perspective) one photo per instance.
Take photo of where a thing was (exact location point the thing was at). This can be useful for sensitive things like people who do not want to be photographed. It can be done in combination with note-taking
Use a timer (30secs, 1min, 2min, 5min) and take a picture (or series of pictures) at a regular interval. This can record the proportion of instances/absences, or help with high volume or dynamic things like litter, flora, people.
Consistancy
portrait or landscape?
distance and angle to subject?
multiple angles?
lighting?
Video?
Tech tip: turn on location services for GPS data
NOTE-TAKING/MARK-MAKING ✍️ 🎨 📝 🔢 📏 🔭
Drawings, measurements, abstract mark making, notations, counts, words, quantities and qualities
Method Options
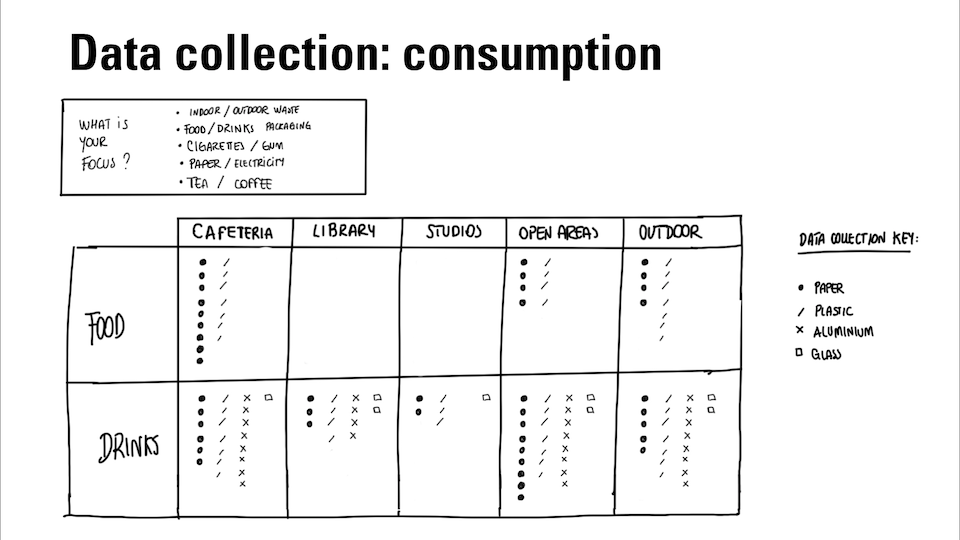
Take notes of observations according to categories or scales of variables you define.
Do drawings/sketches.
Make rubbings of surfaces.
Draw a map.
Scope & Consistancy
what are you looking for and what do you expect to see?
how to categorize different instances?
what other attributes can you gather data on?
how to score/value? numbers: measurements/subjective scores, words: descriptions/feelings
what is your notation system/table structure?
include markers/mini sketches to cross reference photos
note time and location if you don't have a smartphone
COMBINATION
Use taking photos as a button to capture GPS of notation point
SOFTWARE
Exiftool 📸
Extract GPS and other metadata from photos and create a csv file. https://exiftool.org/
Geocode 📇
If you don't have smartphone photos but want to get GPS data for an address this is a great service for encoding multiple addresses. https://geocode.localfocus.nl/
Spreadsheet Software 📸
Software to inspect the data, add extra data points and export the data. There are multiple softwares available for this including Google Sheets, MS Excel, and Open Office. https://www.google.co.uk/sheets/about/
Convert CSV data to GeoJSON data 🌎
To use your data in mapping software it is best to convert it to GeoJSON format. This website does it very easily. https://www.convertcsv.com/csv-to-geojson.htm
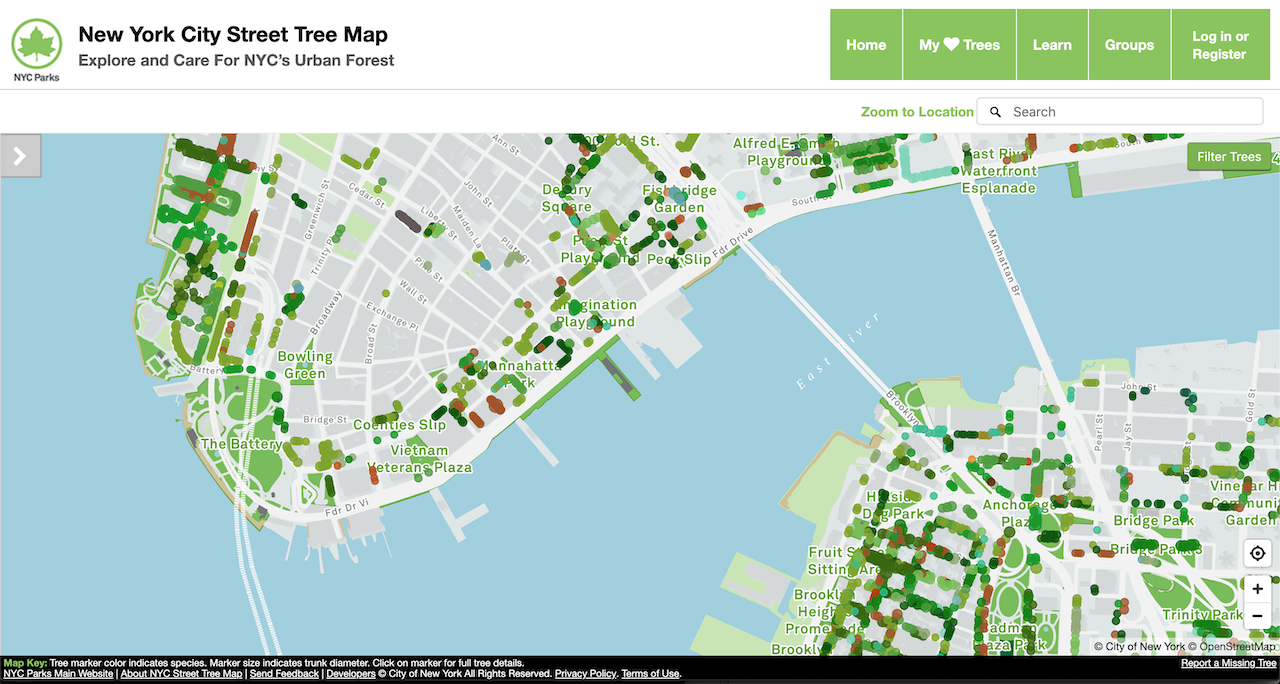
Mapbox 🗺
Software to create customised maps with data and custom styles for the web, applications, VR/AR, print. https://www.mapbox.com/
PROCESS
Define tools and method
Check location services are switched on for your smartphone
Create custom Map style based on their Basic template
Load your data tileset into map style layer
Style data and map
Publish!
SCHEDULE 15th JUNE 2020 (all times local to Colombia) 0930: Begin with welcomes while people get online 0935: Project introduction & workshop briefing 1015: Theme deciding, what do you want to gather data on and how 1100: Walk! (approximately 30-60mins) 1200: Get GPS from photos, add data, convert to geojson 1300: Lunch 1400: Making Maps with Mapbox 1600: Sharing maps, discussion, Q&A 1700: Wrap up and finish workshop 1800: Definitely finished!
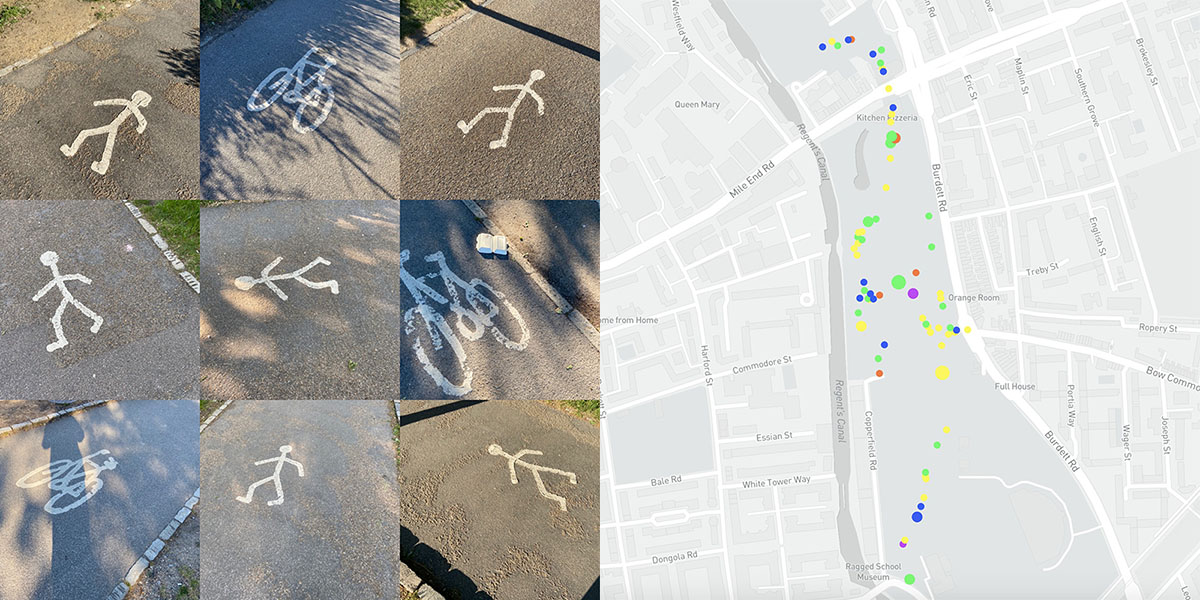
WORKSHOP OUTCOME
In the workshop we each walked our local area gathering data and then creating maps with the data. Here is a map I made with data from two walks, one pre-workshop and a second from the workshop, showing different activities in the park and how many people were taking part in the activity together.