DATA WALKING: LONDON - AMSTERDAM
INTRODUCTION
Data Walking is a framework for people to engage with their surroundings through first hand data enquiry and by creating visualisations build a rich picture of that area, gain insight, share knowledge and processes.
Bringing together people from different perspectives, backgrounds, and locations is what makes participatory design interesting. Whether this is your first time working with data or if you are experienced, this as an opportunity to learn from and with one another.
In this workshop we are lucky enough to have two (or more) locations working together, with a collaboration between Ravensbourne University London and Hogeschool van Amsterdam. Together we will test and try out a brand new set of data gathering apps created for the project. Alternative methods using smartphone photography or notepad and pens are also available. After the walks we will also do a session on visualising data on a map with Mapbox. On Friday there are presentations on what people have created, optional for Londoners.
As a research project it is important to document your activities. I would really appreciate if by the end of the day everyone contributed one or more images of their data gathering/visualising process so I can include it in the project.
WHAT IS DATA?
Data is facts and statistics collected for reference or analysis. Data is a set of values of quantitative or qualitative variables. Data can be encoded (and decoded). Field data is raw data that is collected in an uncontrolled "in situ" environment.
Examples of data include:
- Numbers
- Words
- Drawings, impressions
- abstract notation
- Photographs
Data is measured, collected and reported, and analysed, whereupon it can be visualized through charts other analysis tools.
WHAT IS DATA VISUALISATION?
The representation of information in the form of a chart, diagram, map, picture, etc.
Data visualization refers to the techniques used to communicate data or information by encoding it as visual objects (e.g., points, lines or bars) contained in graphics. The goal is to communicate information clearly and efficiently to users.
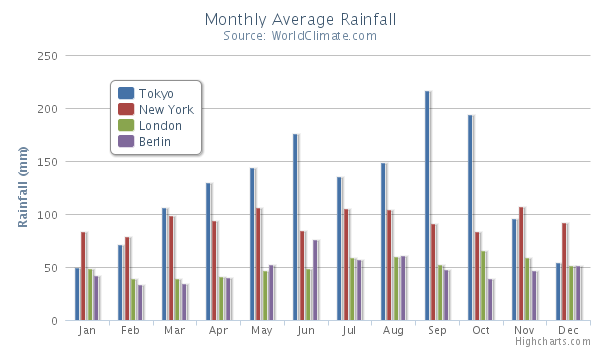
BAR & COLUMN CHART
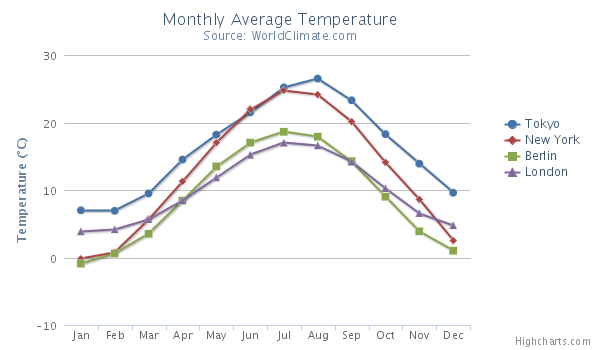
LINE GRAPH
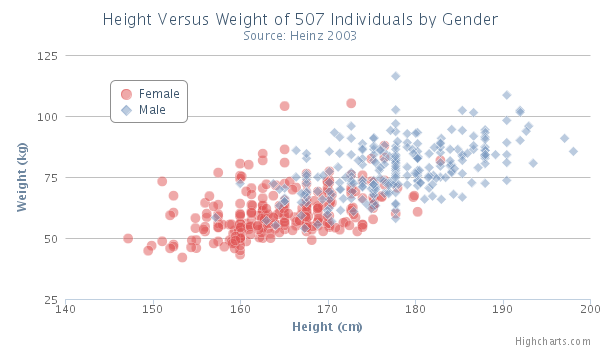
SCATTER PLOT
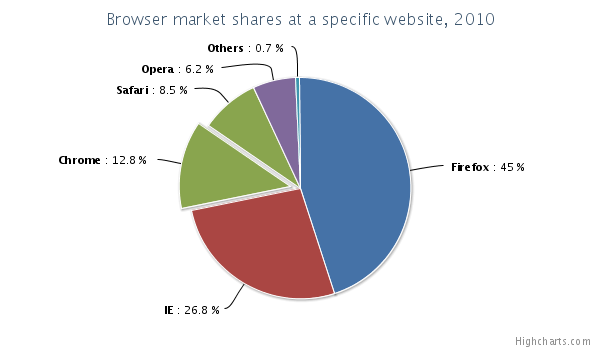
PIE CHART
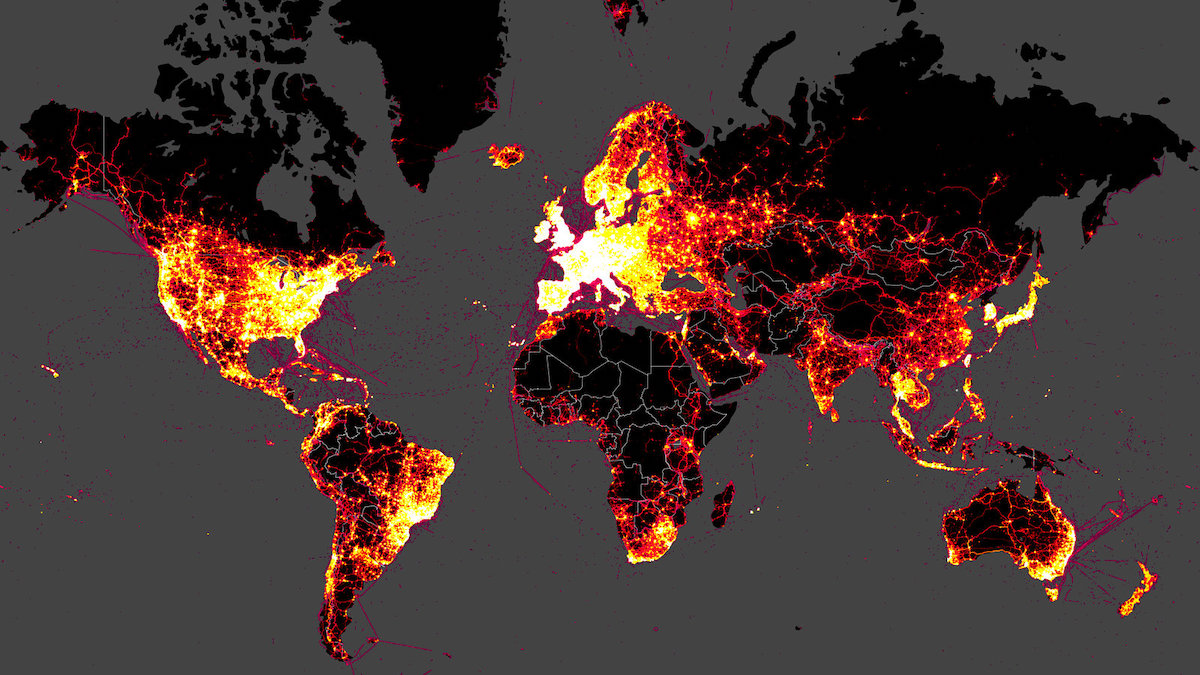
MAP
VISUAL REFERENCES
NAPOLEAN'S RETREAT
Charles Joseph Minard
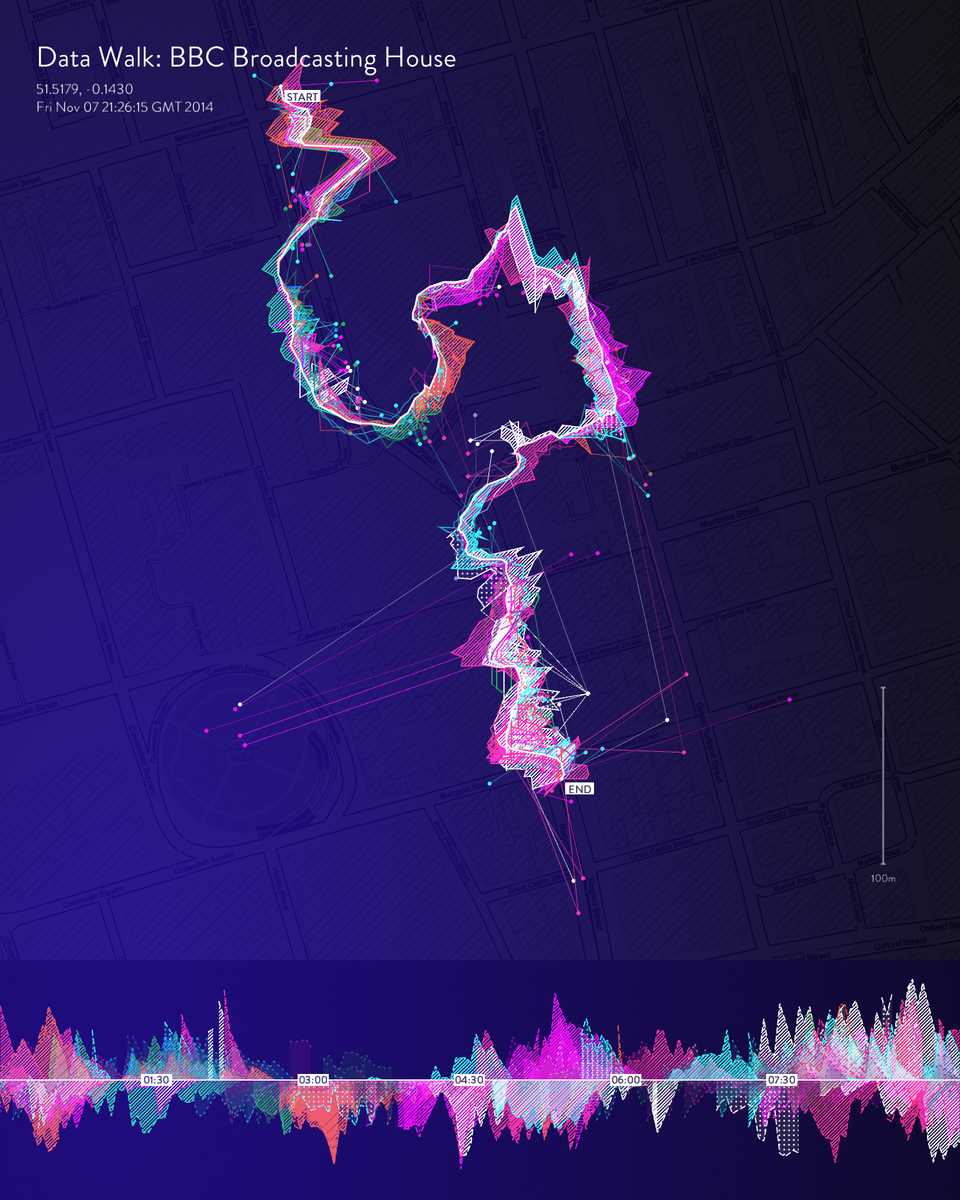
PHANTOM TERRAIN
Stefanie Posavec
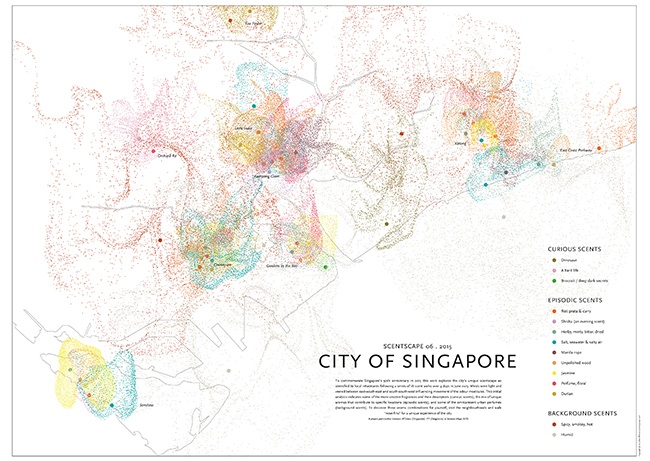
SMELL MAPS
Kate McLean
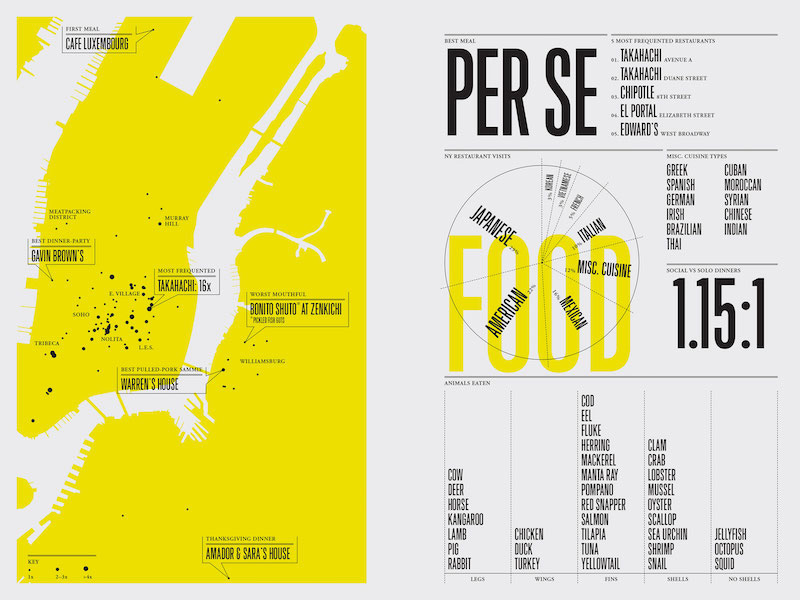
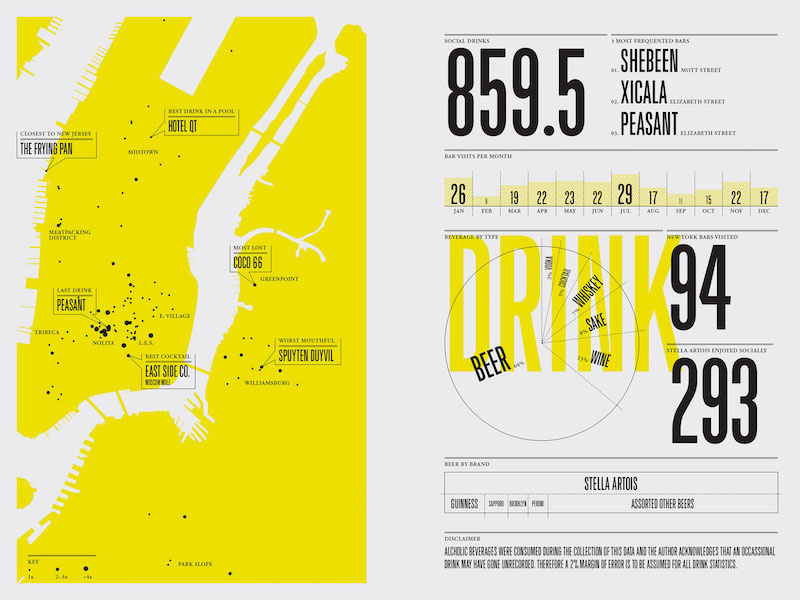
FELTRON Reports
Nicholas Felton
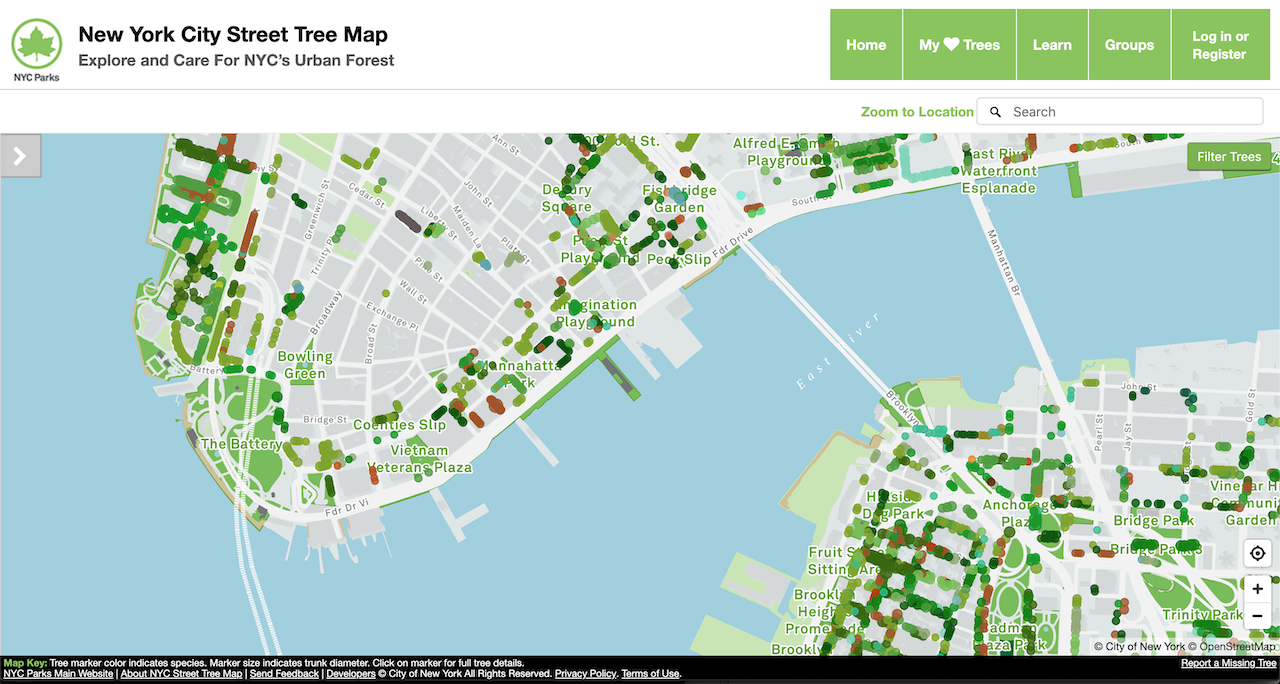
NEW YORK CITY STREET TREE MAP
NYC Parks
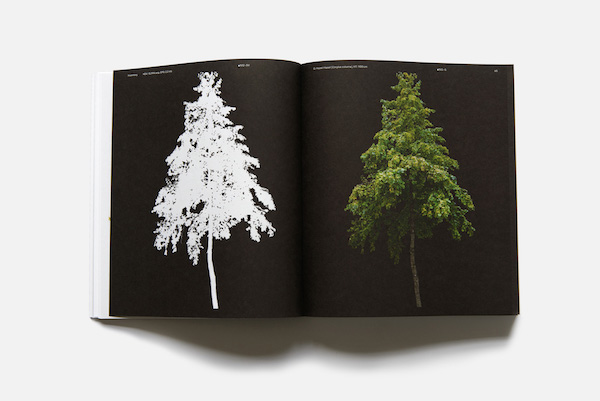
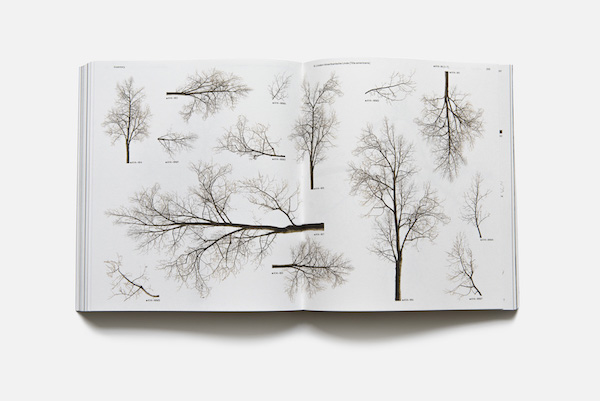
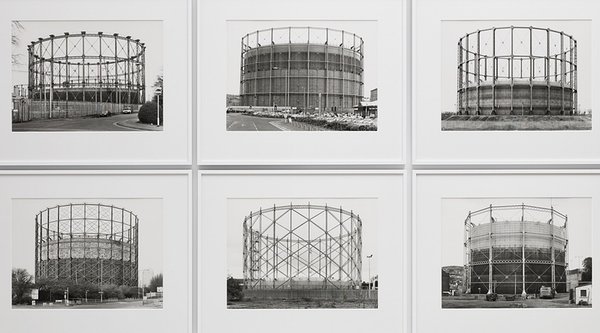
NEUBAU FORST
Neubau Forst Team
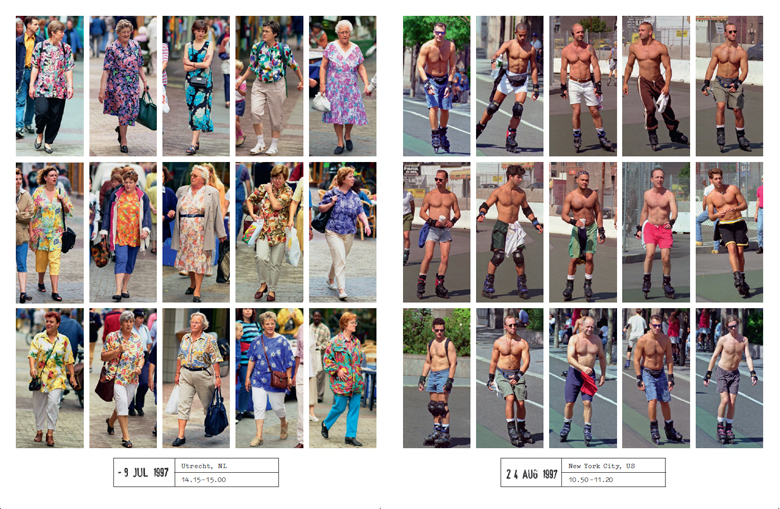
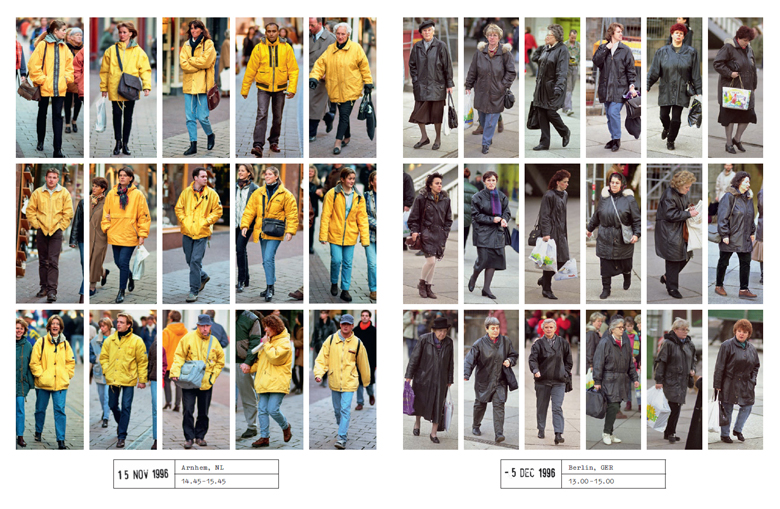
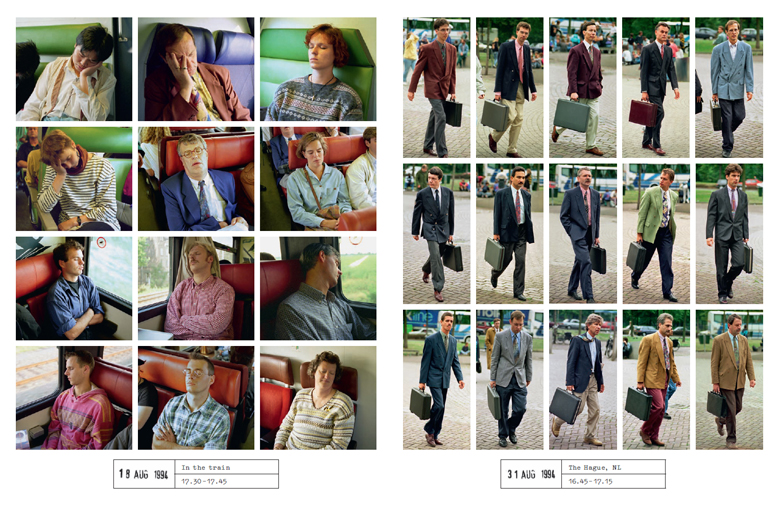
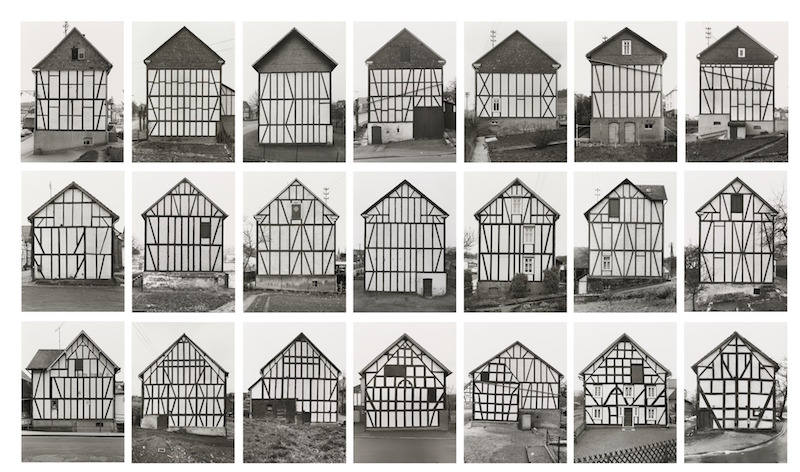
VARIOUS
Hans Eijkelboom
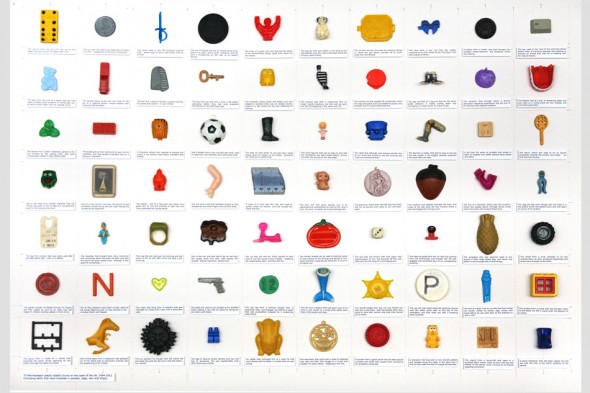
 70 MARINE OBJECTS
Steve McPherson
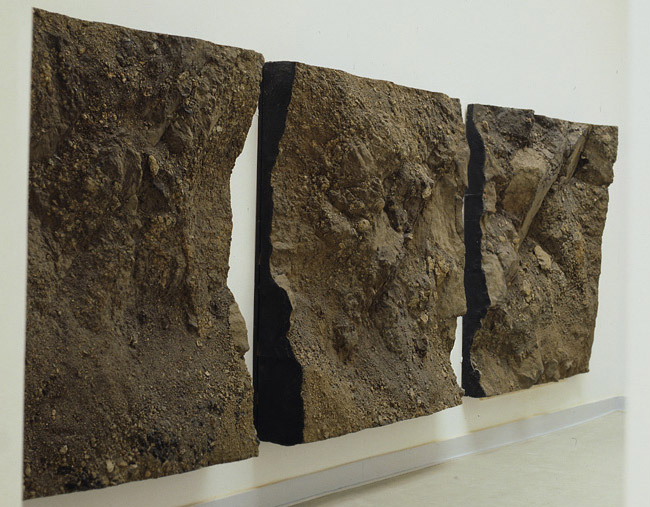
THE WORLD SERIES
Boyle Family
DEAR DATA
Girogia Lupi & Stefanie Posavec
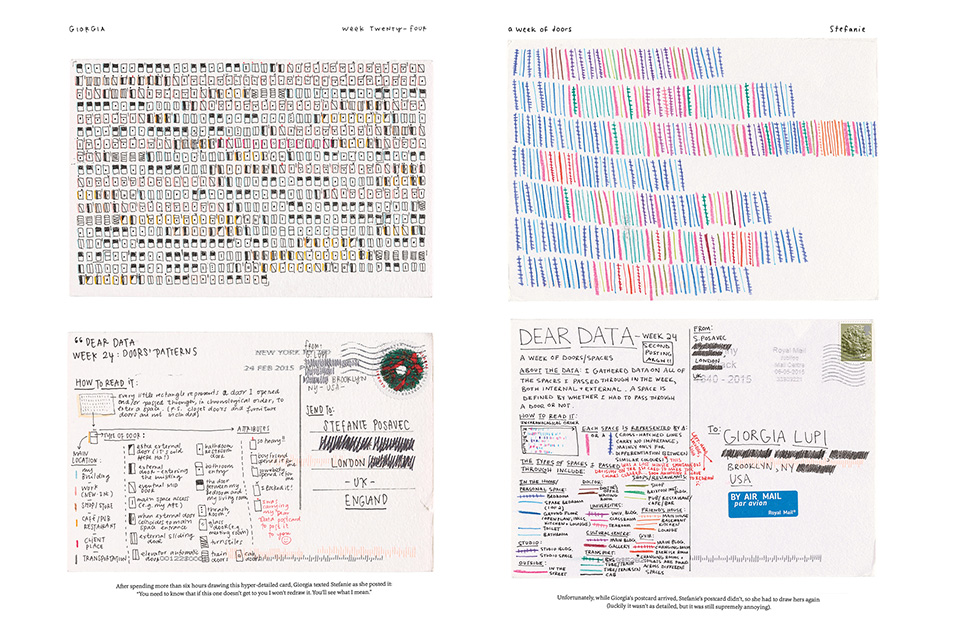
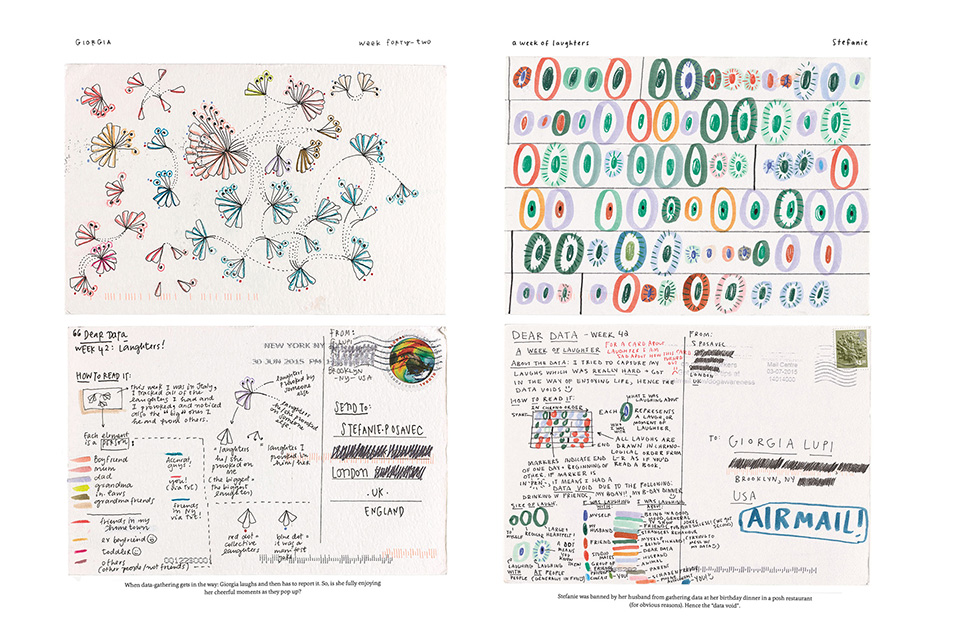
Notice that although these are presented as designed visualisations, almost all of them have gathered their own data.
BRIEF
In this workshop we will explore our local area. We will establish data gathering techniques with the apps or use other methods, walk the area gathering data, and then learn how to create interactive online data-driven maps.
Through multiple participants and perspectives we aim to build multiple and diverse understandings of the environments we walked. The aim is to look at your local area through a different lens.
What can we learn about the places we inhabit? What traces do we leave within these places? What does this content say about us? Can we build a picture of the community based on this data? How does what we find enrich our understanding of a community? How does it challenge our expectations/bias and expose our own backgrounds?
CONSIDERATIONS
When deciding on a data gathering method, are you gathering the right data for your theme? Have you considered time frame and frequency of data occurrence?
How focused should we be in what we gather data on? If we are too focused do we miss something else interesting, if we are too broad do we lack the detail to make interesting insights?
You may gather data on multiple themes and consider the interrelationship between different aspects. You could consider multiple walks.
Please do not break any local rules imposed by quarantine or lockdown! Your health & wellbeing is more important than the workshop!
THEMES INSPIRATION
GREEN SPACES
amount, size, characteristics, usage, shadiness, openess
FLORA & FAUNA
amount, size, types, biodiversity
LITTER
amount, characteristics, litter bins
POLLUTION
air quality (perceived/measured), noise, visual
MESSAGING
amount, characteristics, signage, wayfinding, advertising, posters, flyposting, graffiti
SECURITY
amount, characteristics, cameras, fences, physical control measure, guards, bike locks
VEHICLES
amount, characteristics, type, cars, trucks, motorbikes, bikes, speed, traffic, stationary, parked, interactions, arguments/incidents
PEOPLE
amount, density, characteristics, occupation, behaviour
ARCHITECTURE
age, style, condition, characteristics, function, usage
APPS
COUNT
Count occurences of discrete entities, for example count different vehicles and their type that you pass on a walk.
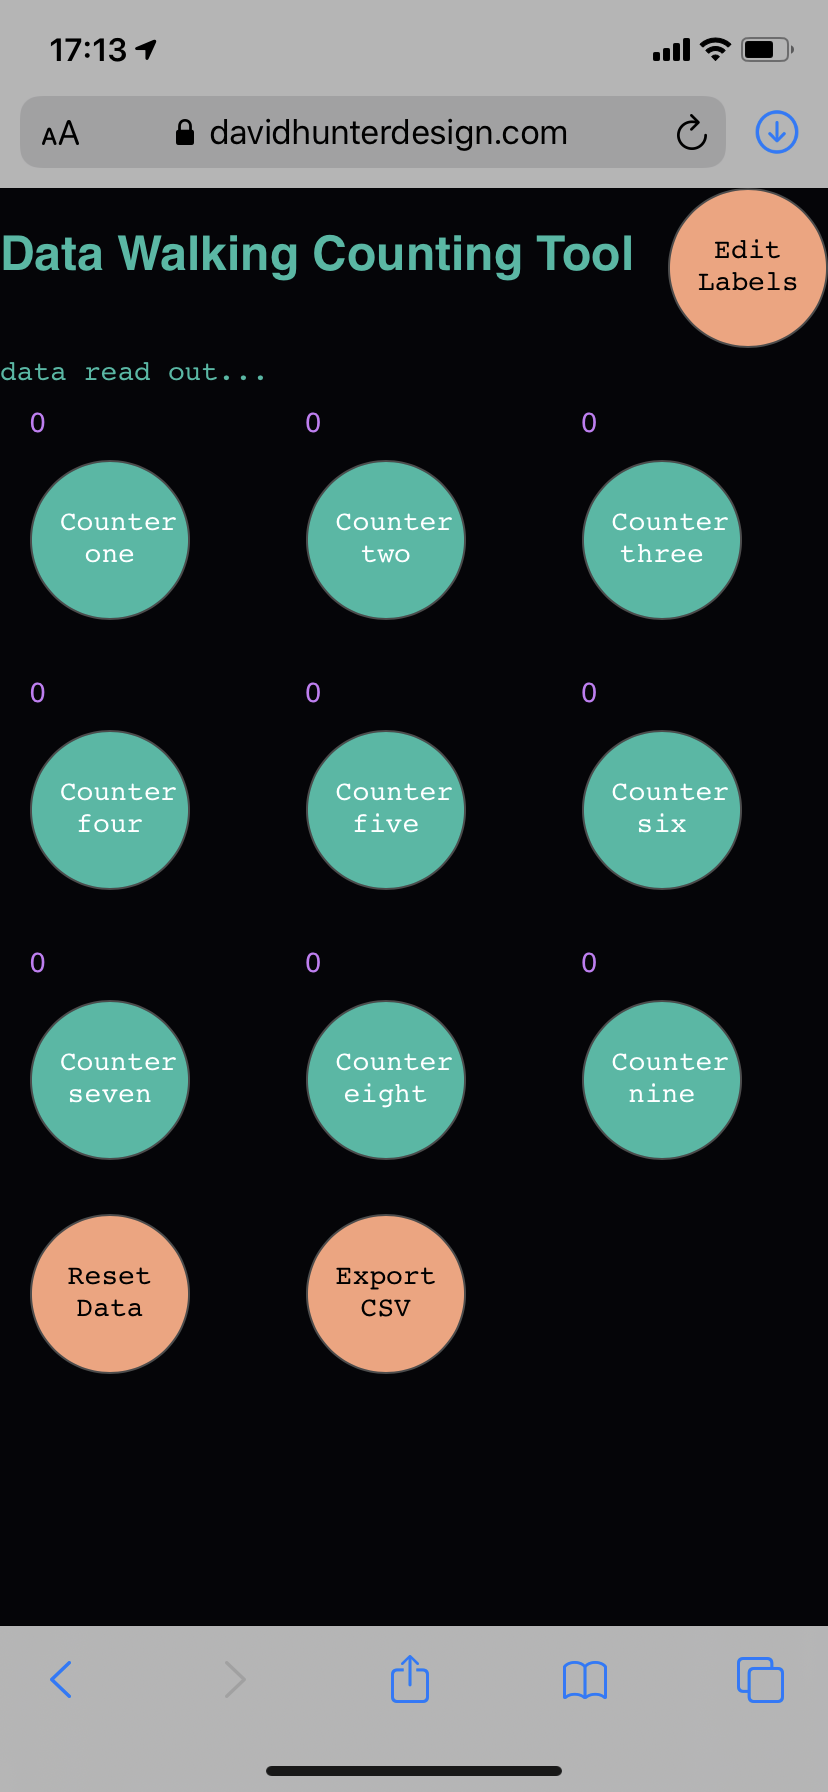
Example map: animals spotted
RANGE
Input a number value within a range, for example how much you enjoy the view at a location on a scale of 0-10.
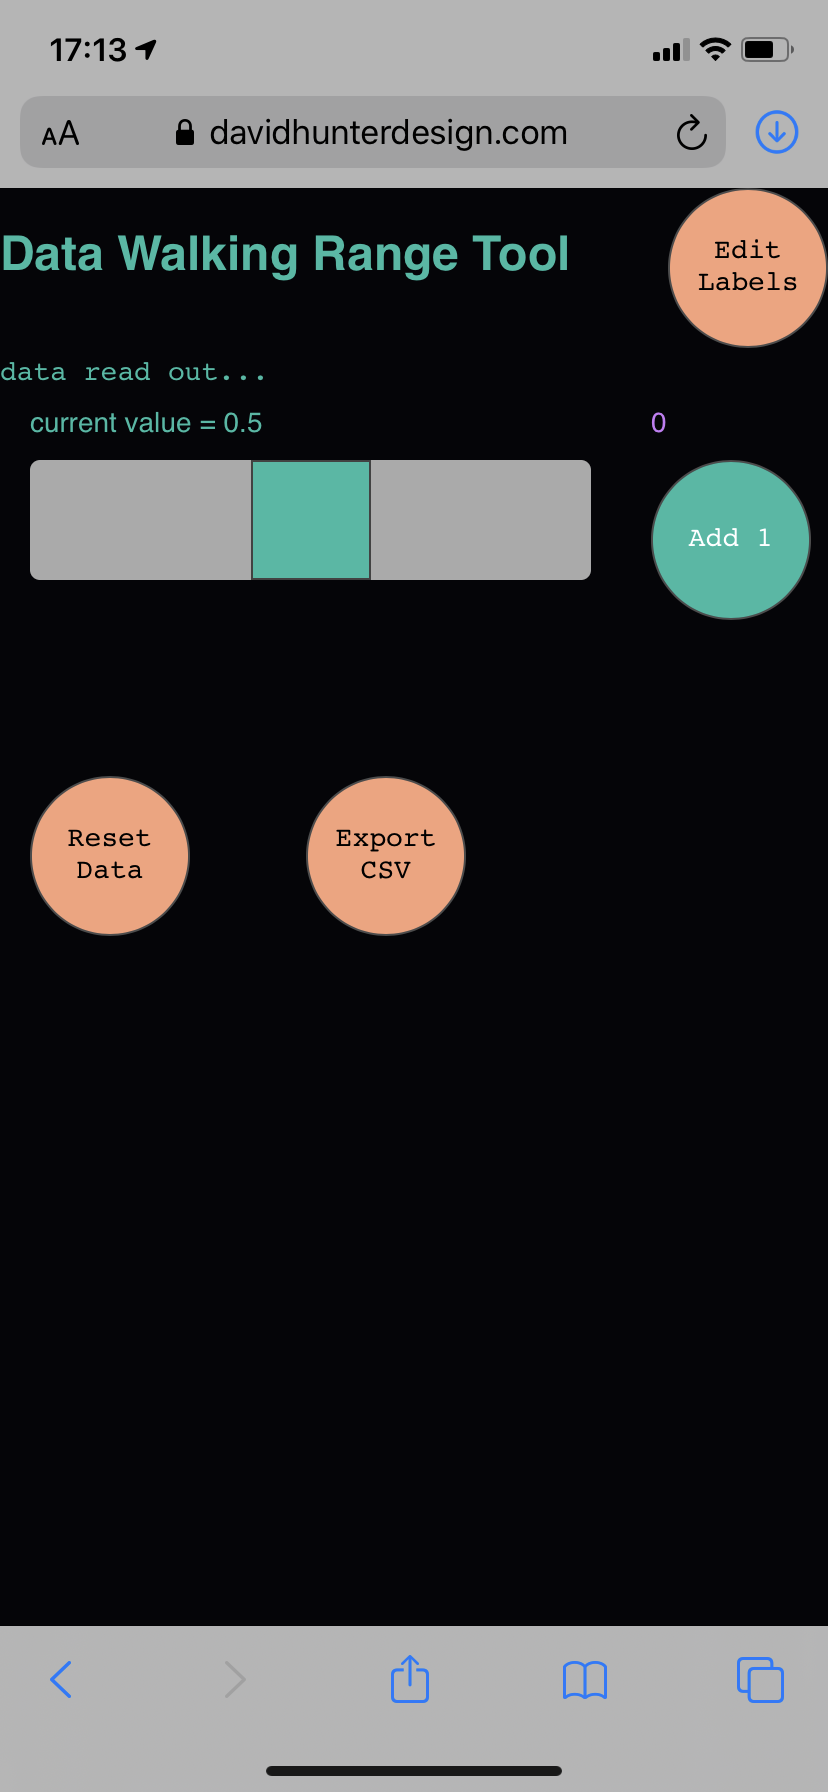
Example map: distance from people
WORDS
Input a word or passage of text, for example write down memories from different locations. Warning: please do not use punctuation (,.!) in your text.
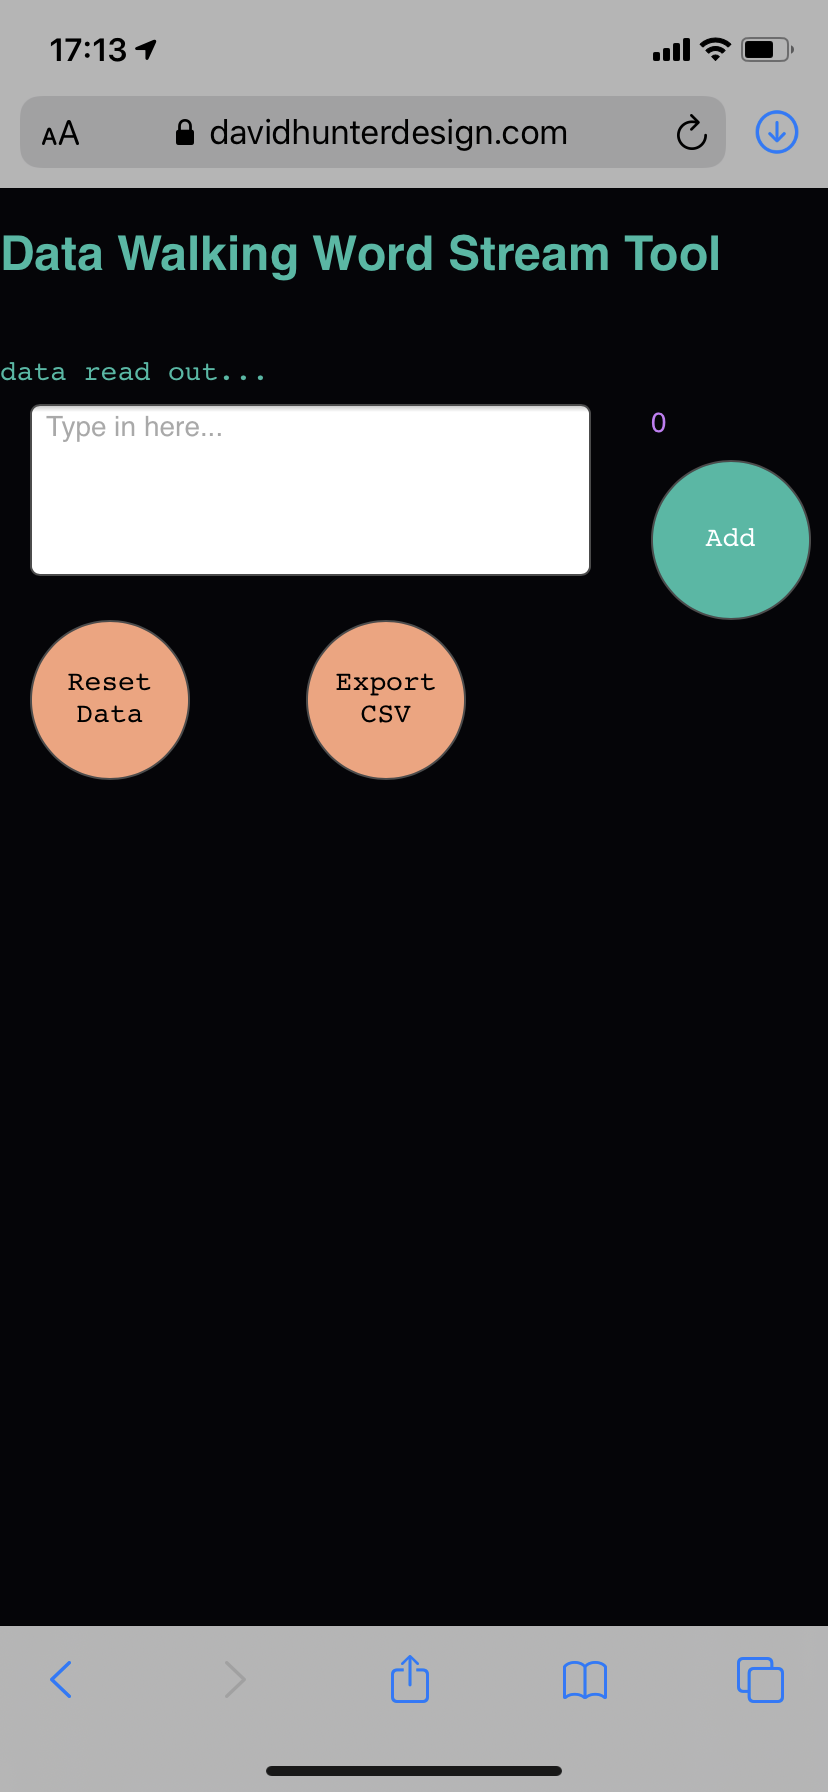
Example map: journey thoughts
INSTRUCTIONS
» Enable location tracking, without this the app will not work.
» 'Edit Labels' to rename buttons, change the range scale.
» There is no start stop button, data and geolocation is logged when you input a value and press a button.
• For Count App press a counter button to log an instance of what you want to count.
• For Range App move the slider to the desired value, press the 'Add' button to log the value.
• For Words App select the text box, type in your text, press the 'Add' button to log the text.
» Press 'Export CSV' to export the data, select the download option to save to your phone file system.
» 'Reset Data' or reload the webpage if you want to restart. This will wipe any data recorded!
ALTERNATIVE TOOLS
PHOTOGRAPHY 📸 📱 🤳
Take photos with a smartphone
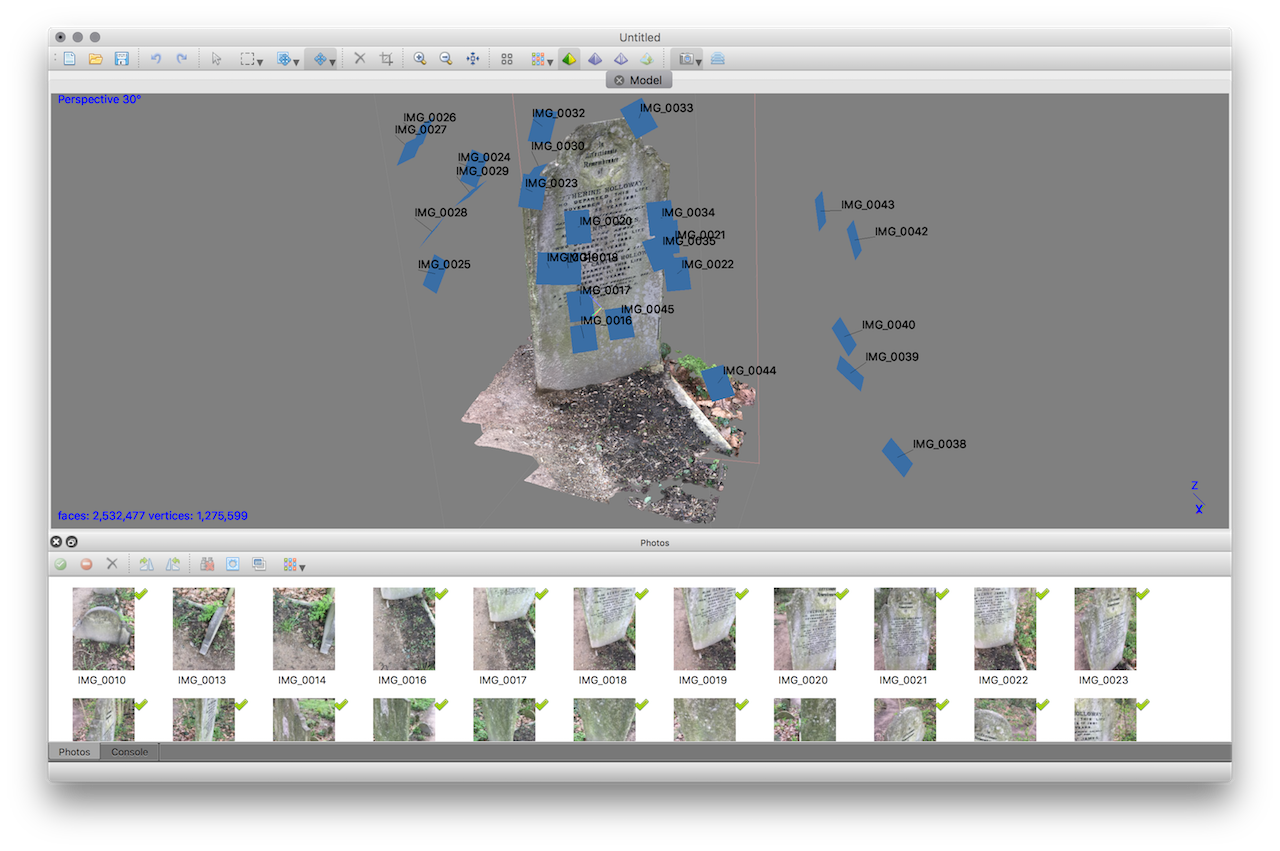
Method Options
- Take photos of every instance of a thing you see (your perspective) and capture multiple instances in a single photo.
- Take a photo of every single instance (your perspective) one photo per instance.
- Take photo of where a thing was (exact location point the thing was at). This can be useful for sensitive things like people who do not want to be photographed. It can be done in combination with note-taking
- Use a timer (30secs, 1min, 2min, 5min) and take a picture (or series of pictures) at a regular interval. This can record the proportion of instances/absences, or help with high volume or dynamic things like litter, flora, people.
Consistancy
- portrait or landscape?
- distance and angle to subject?
- multiple angles?
- lighting?
- Video?
- Tech tip: turn on location services for GPS data
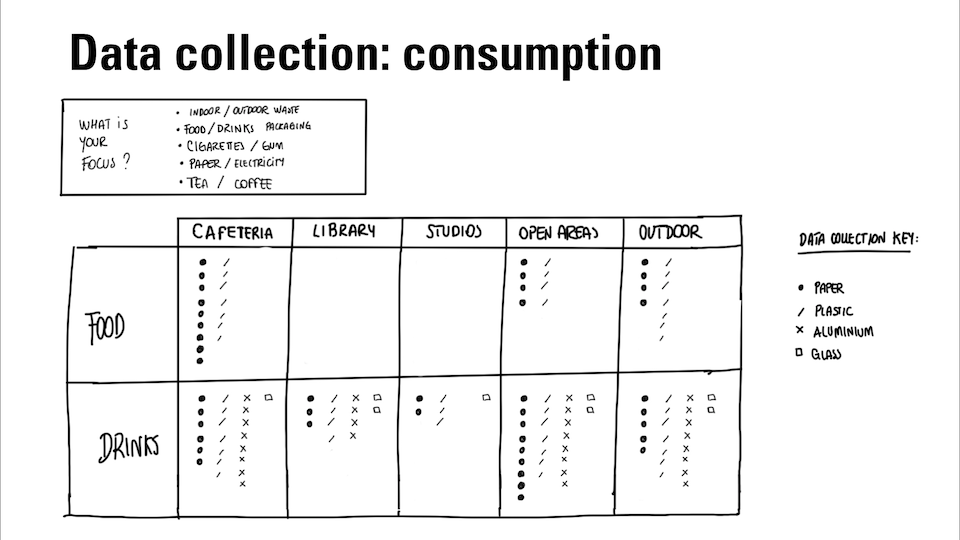
NOTE-TAKING/MARK-MAKING ✍️ 🎨 📝 🔢 📏 🔭
Drawings, measurements, abstract mark making, notations, counts, words, quantities and qualities

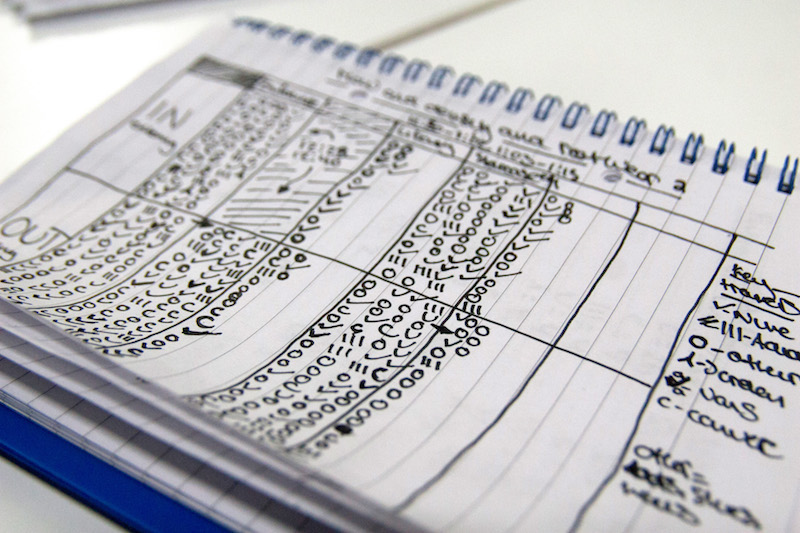
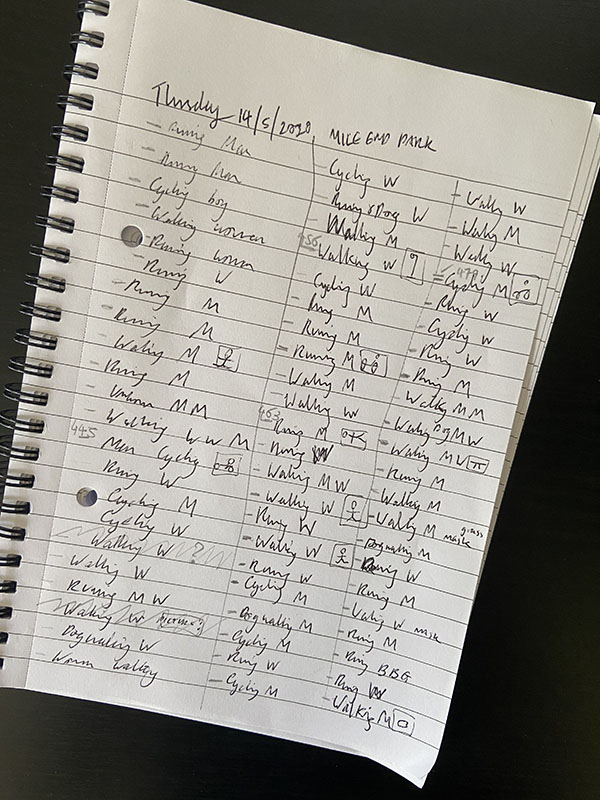
Method Options
- Take notes of observations according to categories or scales of variables you define.
- Do drawings/sketches.
- Make rubbings of surfaces.
- Draw a map.
Scope & Consistancy
- what are you looking for and what do you expect to see?
- how to categorize different instances?
- what other attributes can you gather data on?
- how to score/value? numbers: measurements/subjective scores, words: descriptions/feelings
- what is your notation system/table structure?
- include markers/mini sketches to cross reference photos
- note time and location if you don't have a smartphone
COMBINATION
Use taking photos as a button to capture GPS of notation point
SOFTWARE
Exiftool 📸
Extract GPS and other metadata from photos and create a csv file.
https://exiftool.org/
Geocode 📇
If you don't have smartphone photos but want to get GPS data for an address this is a great service for encoding multiple addresses.
https://geocode.localfocus.nl/
Spreadsheet Software 📸
Software to inspect the data, add extra data points and export the data. There are multiple softwares available for this including Google Sheets, MS Excel, and Open Office.
https://www.google.co.uk/sheets/about/
Convert CSV data to GeoJSON data 🌎
To use your data in mapping software it is best to convert it to GeoJSON format. This website does it very easily.
https://www.convertcsv.com/csv-to-geojson.htm
Mapbox 🗺
Software to create customised maps with data and custom styles for the web, applications, VR/AR, print.
https://www.mapbox.com/
PROCESS
- Define theme and what to gather data on
- Decide which app to use
- Check the app works on your device
- Walk and capture data
- download GeoJSON/CSV file and send to your computer
- If necessary convert data to geojson using convertcsv.com
- Create dataset & tileset in Mapbox
- Create custom Map style based on their Basic template
- Load your data tileset into map style layer
- Style data and map
- Publish!
SCHEDULE (UK time)
8th FEBRUARY 2022
10:00- Workshop welcome and Data Walking project introduction
10:30- Workshop Briefing
11:00- Theme deciding, what do you want to gather data on, app testing
12:00- Walk! (approximately 20-60mins)
14:00- Get data from phone onto computer, and making maps with Mapbox
15:00- Sharing maps, discussion, Q&A
11th FEBRUARY 2022
10:00- Presentations (optional for those in London)
12:00- Workshop finished!
AREA
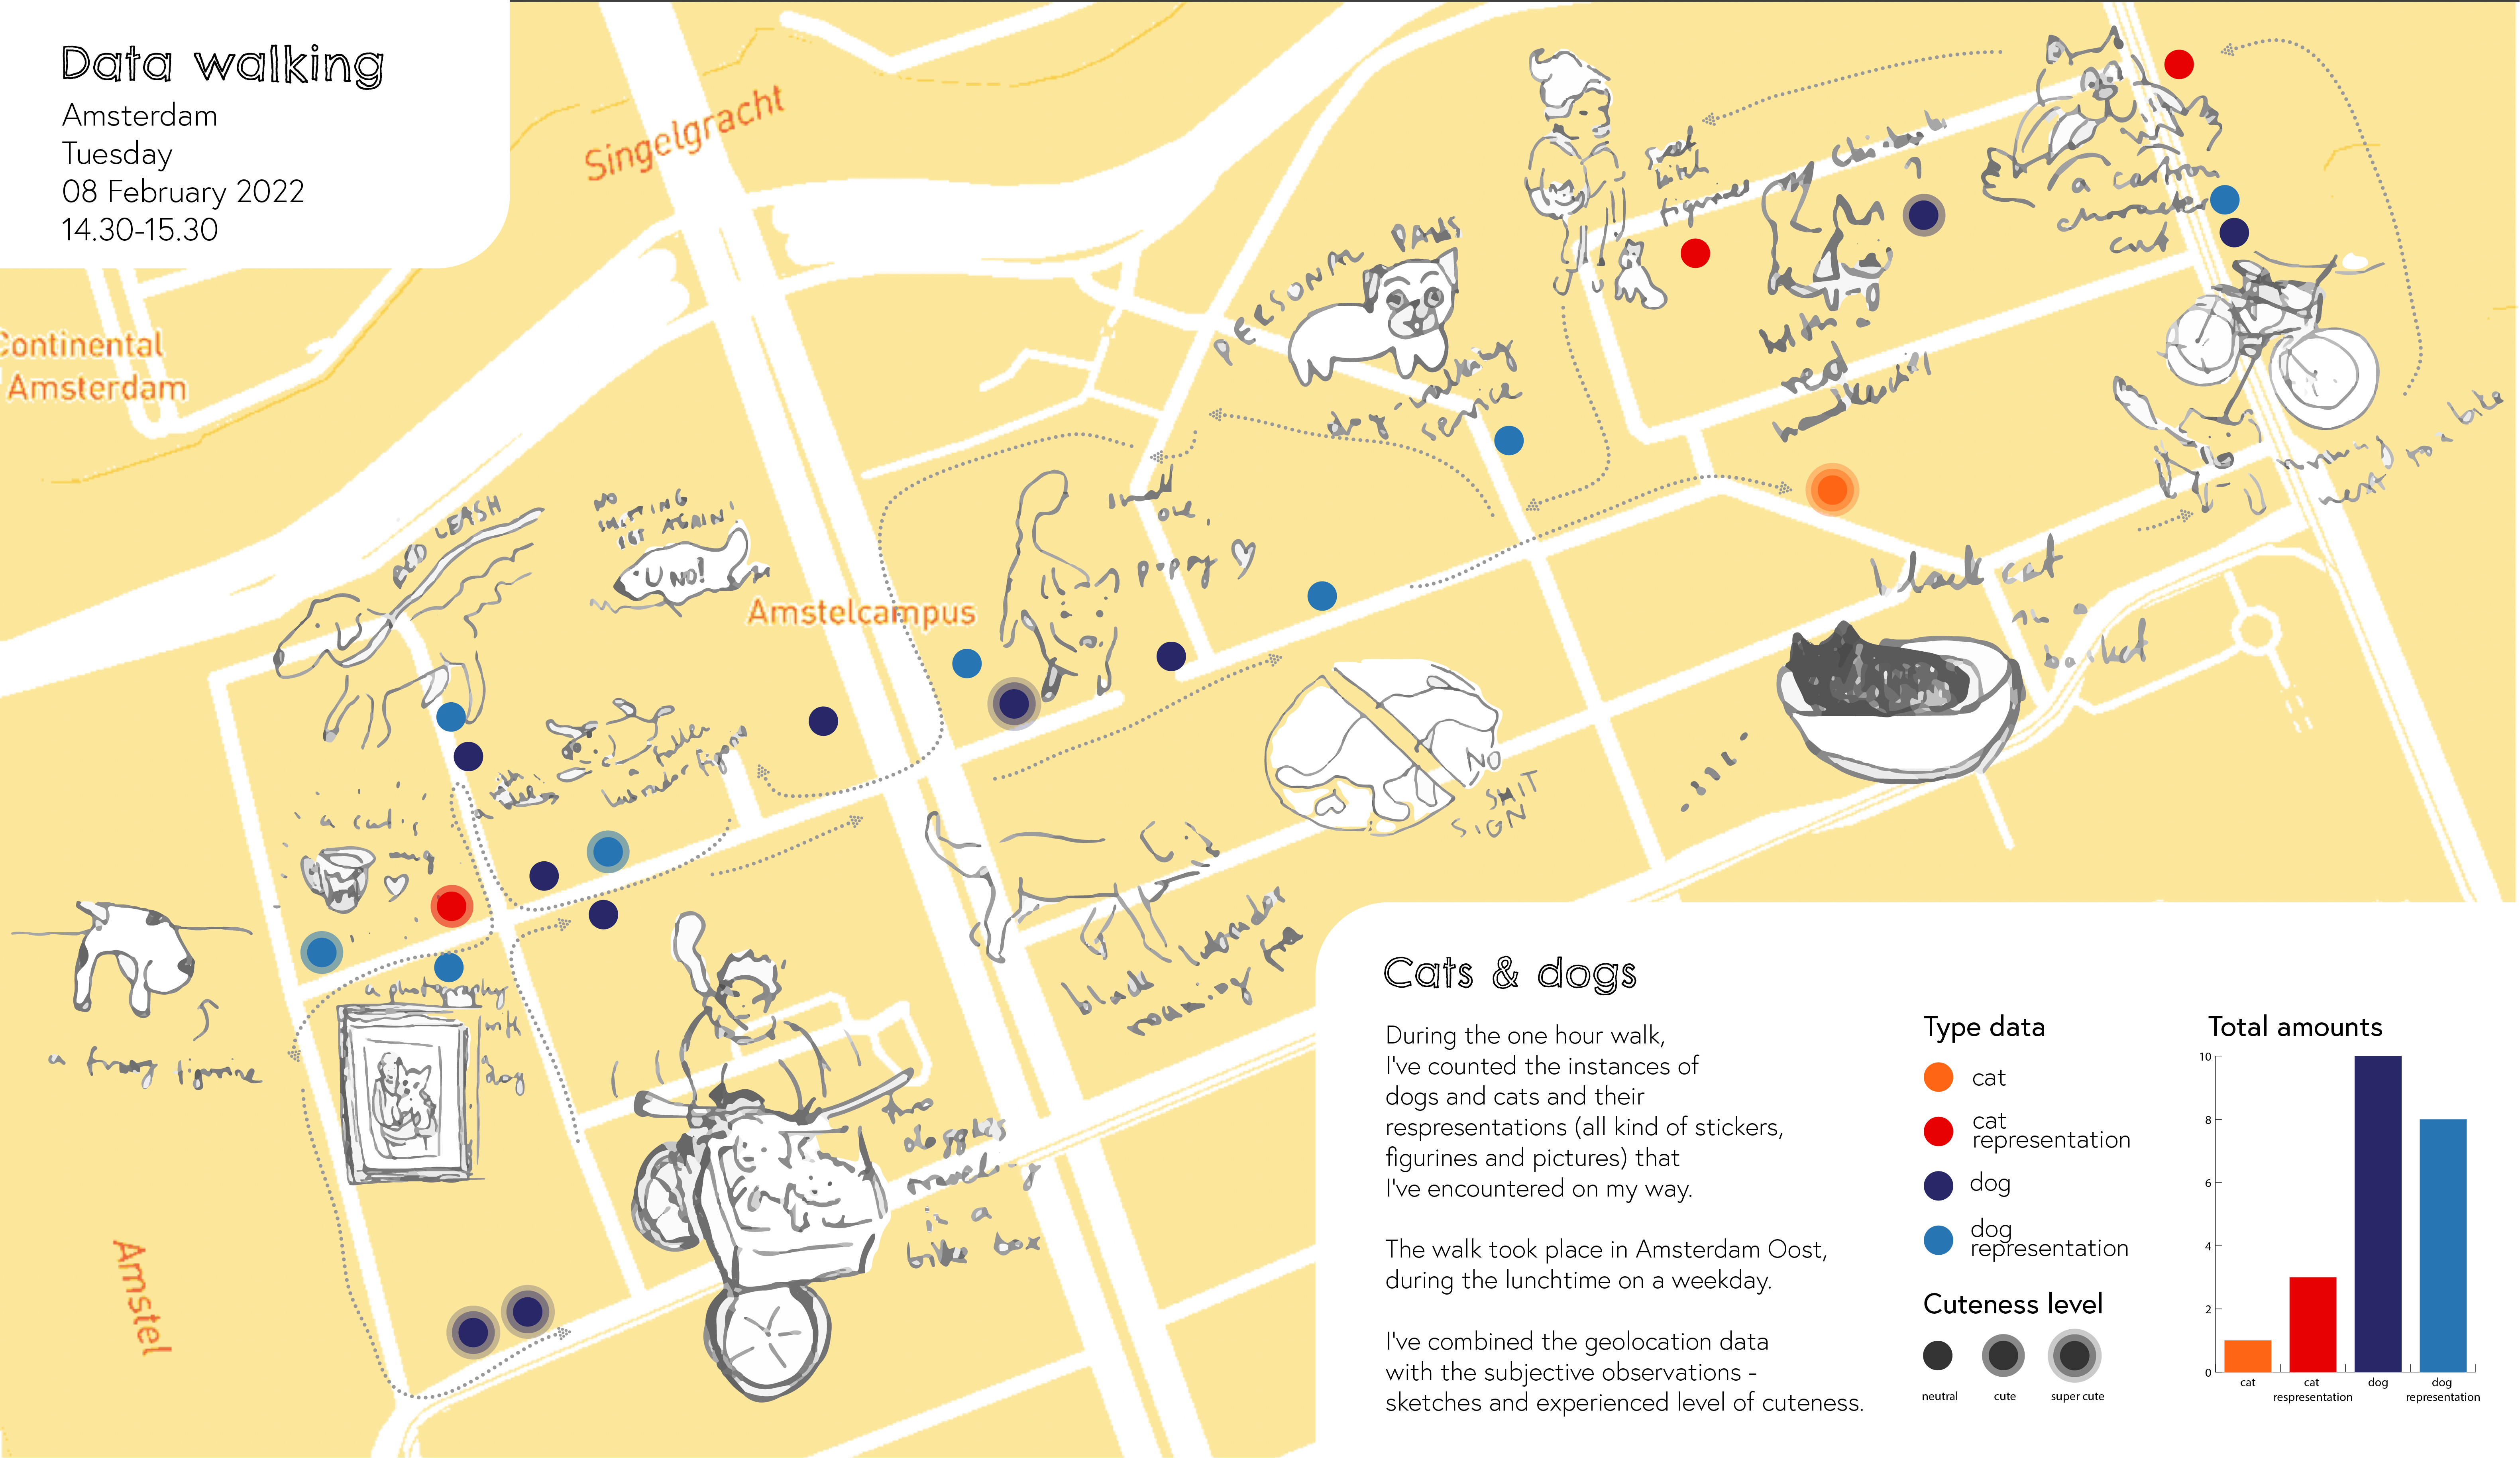
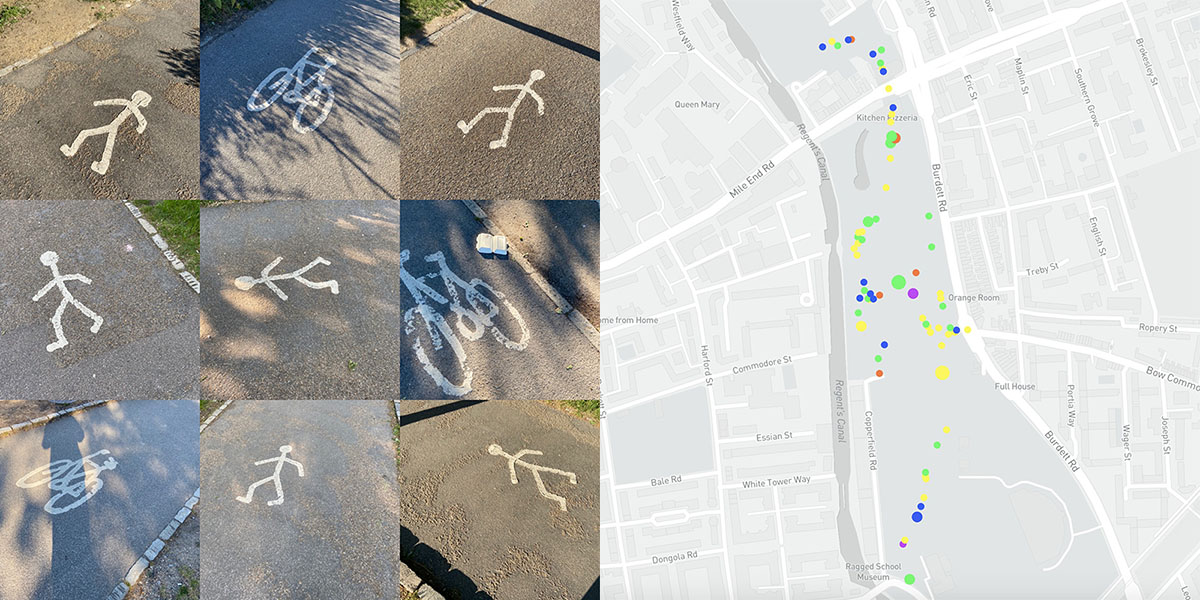
WORKSHOP OUTCOME
In the workshop students walked their local area gathering data and then creating maps with the data. Here is a map from one student, Aleksandra Pawelec.